Fig. B.2.
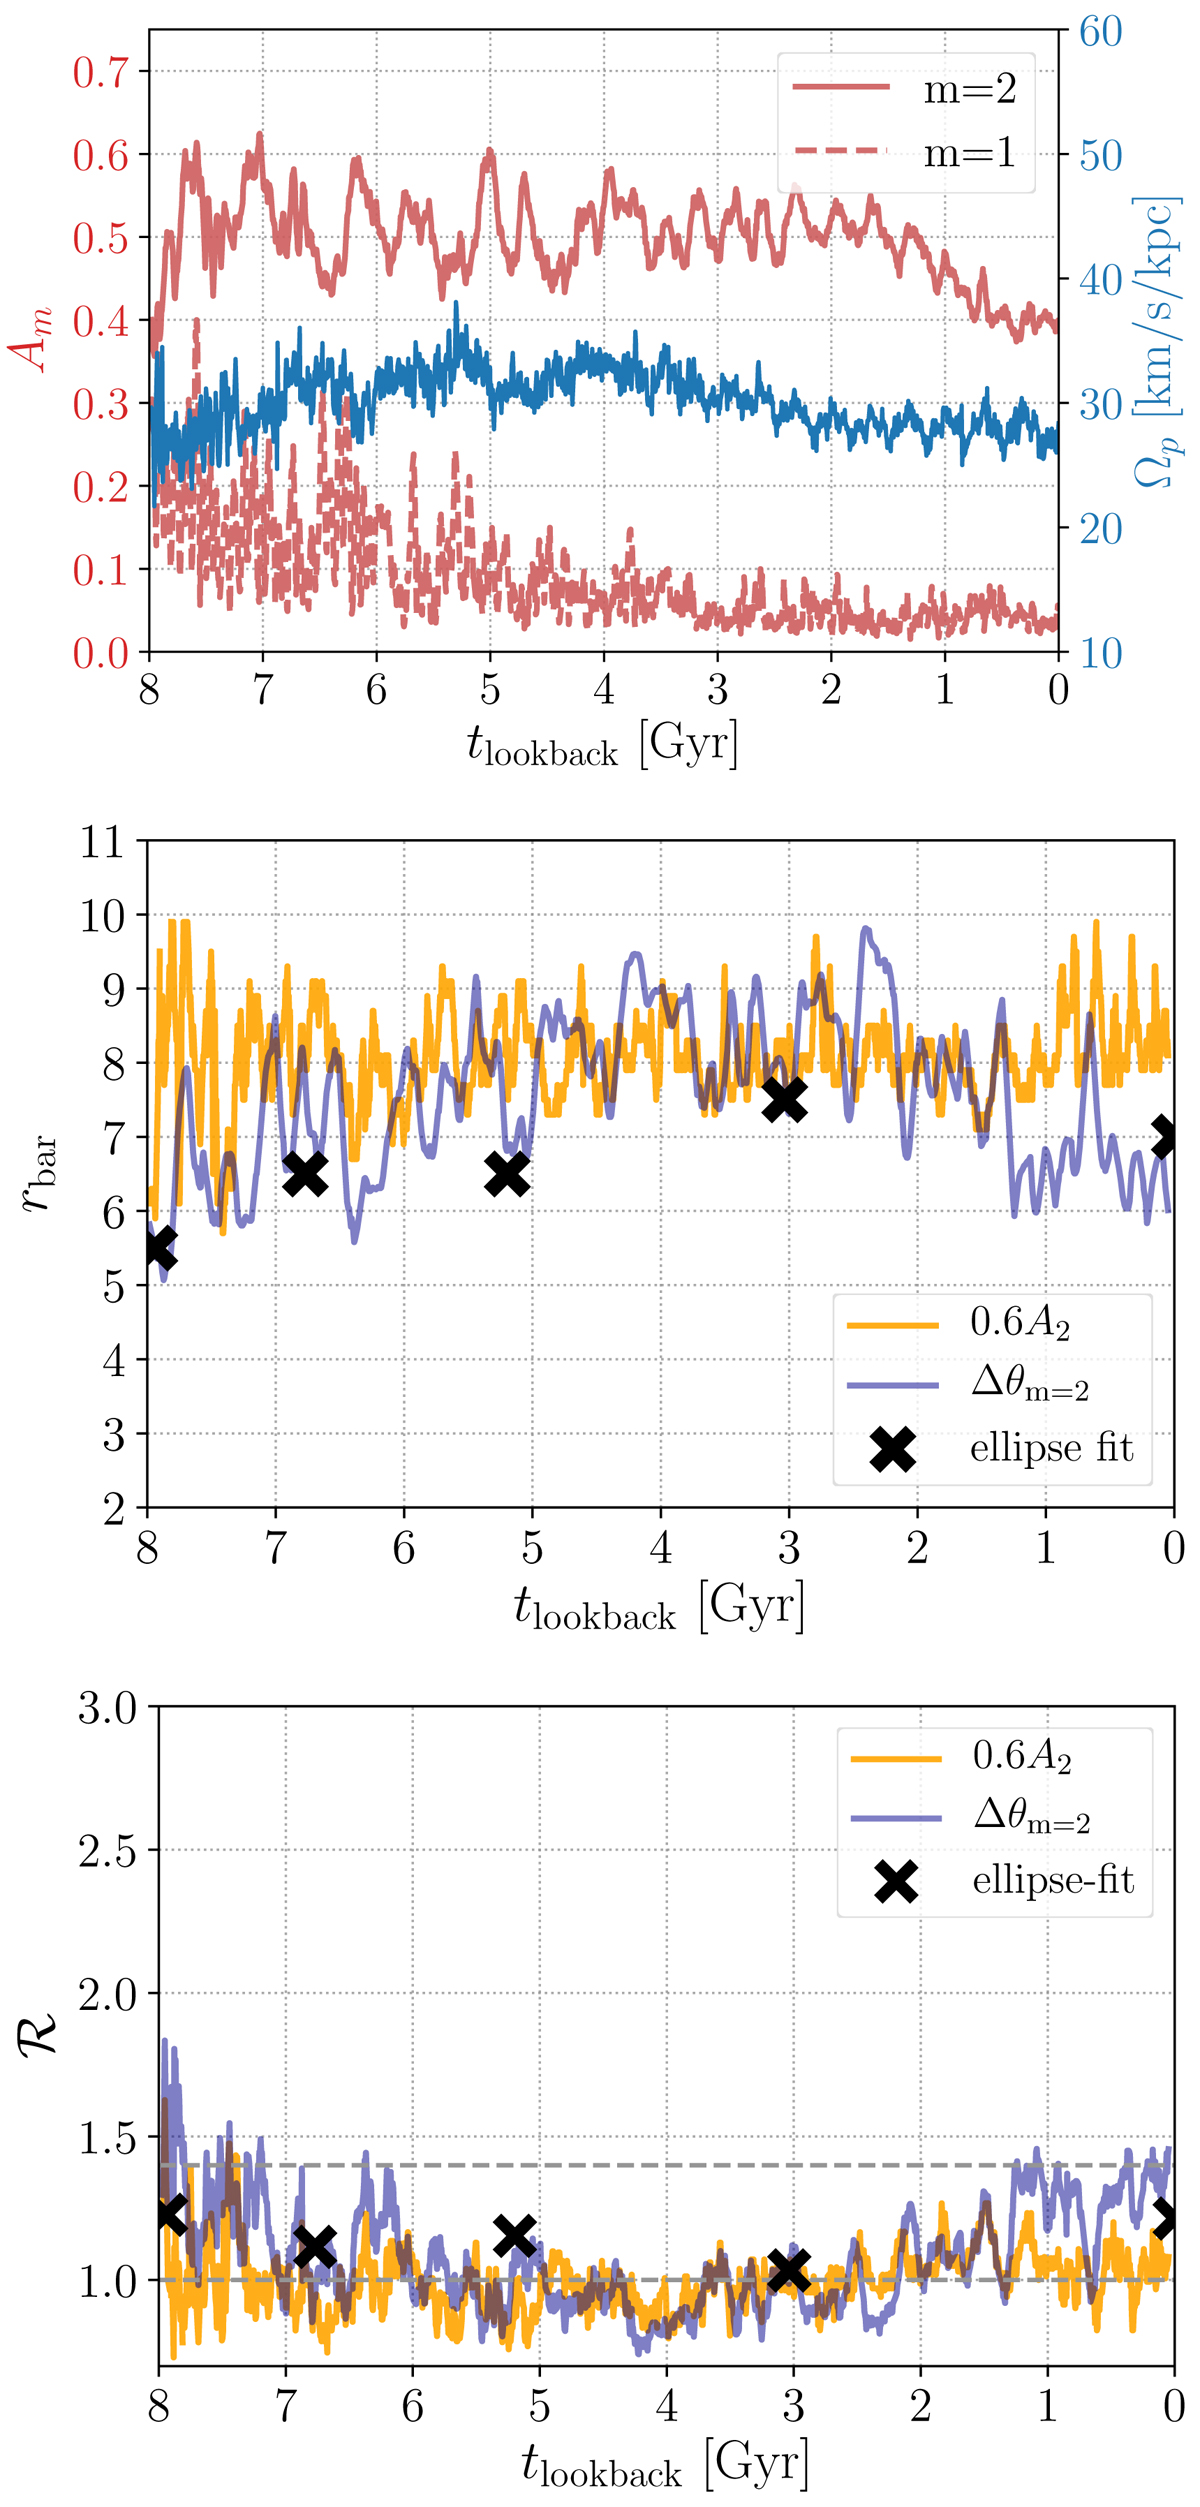
Bar strength, pattern speed, and length variation for Au18 with time. Top panel: pattern speed as estimated from the phase of the m = 2 Fourier mode (right axis – blue), the m = 2 Fourier mode (bar strength) of the surface density, and the m = 1 Fourier mode (dashed red line) as a function of lookback time. Middle panel: various measures of bar length as a function of lookback time (see text). Bottom panel: variation in ℛ as a function of time using different estimates for the bar length.
Current usage metrics show cumulative count of Article Views (full-text article views including HTML views, PDF and ePub downloads, according to the available data) and Abstracts Views on Vision4Press platform.
Data correspond to usage on the plateform after 2015. The current usage metrics is available 48-96 hours after online publication and is updated daily on week days.
Initial download of the metrics may take a while.