Fig. B.1.
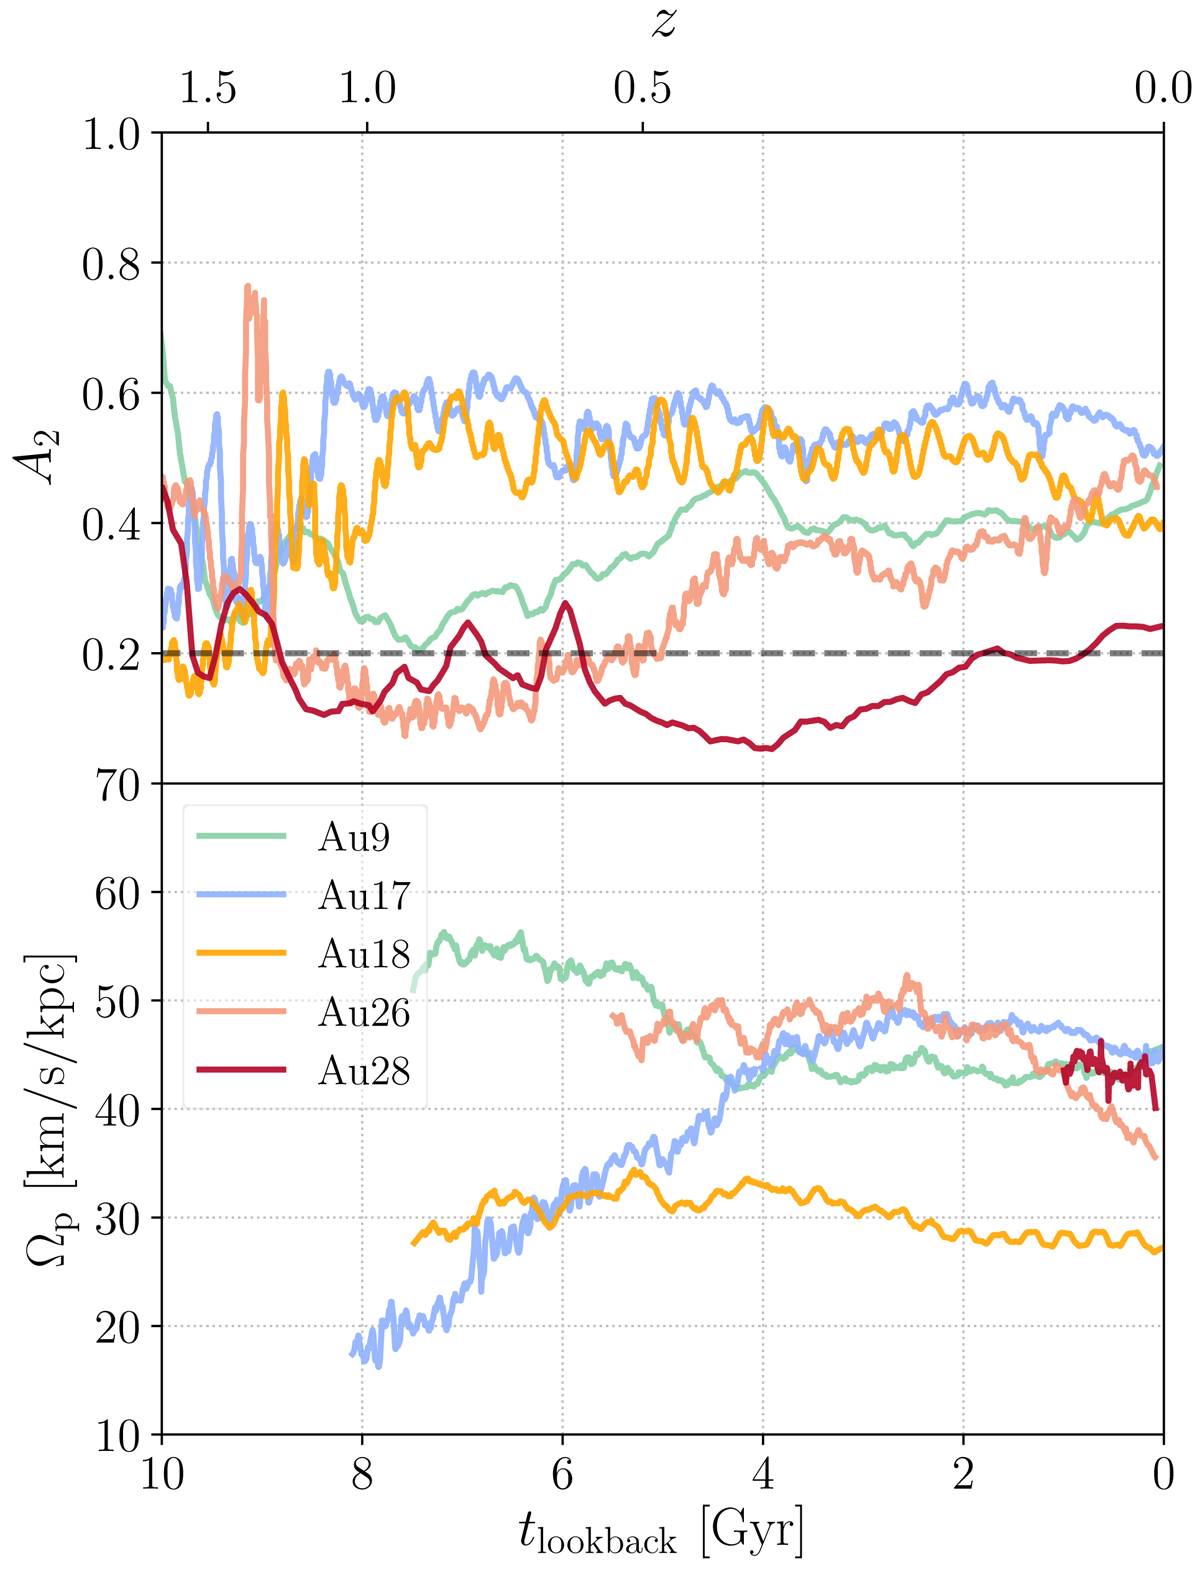
Bar properties as a function of time. Top panel: bar strength for the five Auriga galaxies for which we have high cadence outputs as a function of lookback time. The horizontal dashed line indicates A2 = 0.2, above which we consider the bar to have formed. Bottom panel: bar pattern speed for these galaxies once the bar has formed as a function of lookback time.
Current usage metrics show cumulative count of Article Views (full-text article views including HTML views, PDF and ePub downloads, according to the available data) and Abstracts Views on Vision4Press platform.
Data correspond to usage on the plateform after 2015. The current usage metrics is available 48-96 hours after online publication and is updated daily on week days.
Initial download of the metrics may take a while.