Fig. 3.
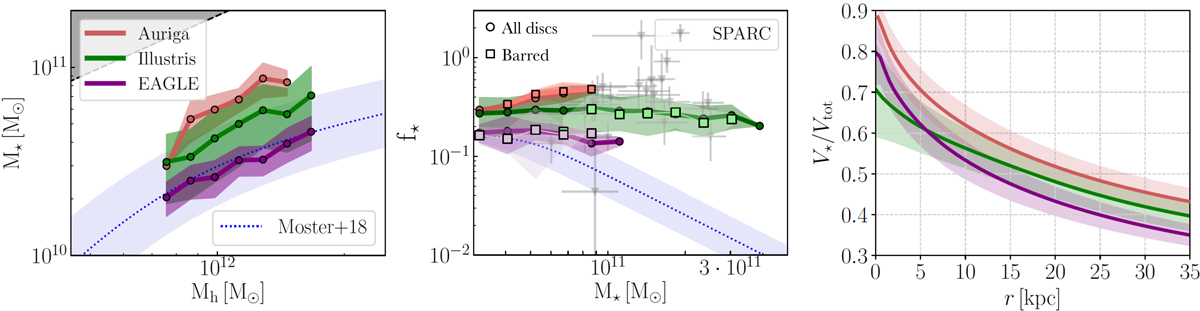
Global and local stellar-to-dark matter ratios in the Auriga galaxies as compared to EAGLE and Illustris. Left: mean (lines) and 1σ (shaded region) values of the M⋆ vs. Mh of Auriga, EAGLE, and Illustris disc galaxies at z = 0 compared to the abundance matching relation from Moster et al. (2018). Middle: efficiency with which gas is turned into stars, i.e.,, ![]() as a function of stellar mass for the Auriga, EAGLE and Illustris galaxies, compared to the relation from abundance matching. The mean and 1σ values for disc (barred) galaxies are shown with the circles/thick lines (squares/thin lines) and shaded region respectively. For comparison, we also show the high-mass disc galaxies from the SPARC sample explored in Marasco et al. (2020), where the error bars denote 16th–84th percentile uncertainties. Right: baryon dominance, V⋆/Vtot, as a function of radius of Auriga, EAGLE, and Illustris disc galaxies in the mass range 3 × 10¹⁰ < M⋆/M⊙ < 1011.
as a function of stellar mass for the Auriga, EAGLE and Illustris galaxies, compared to the relation from abundance matching. The mean and 1σ values for disc (barred) galaxies are shown with the circles/thick lines (squares/thin lines) and shaded region respectively. For comparison, we also show the high-mass disc galaxies from the SPARC sample explored in Marasco et al. (2020), where the error bars denote 16th–84th percentile uncertainties. Right: baryon dominance, V⋆/Vtot, as a function of radius of Auriga, EAGLE, and Illustris disc galaxies in the mass range 3 × 10¹⁰ < M⋆/M⊙ < 1011.
Current usage metrics show cumulative count of Article Views (full-text article views including HTML views, PDF and ePub downloads, according to the available data) and Abstracts Views on Vision4Press platform.
Data correspond to usage on the plateform after 2015. The current usage metrics is available 48-96 hours after online publication and is updated daily on week days.
Initial download of the metrics may take a while.