Fig. 2.
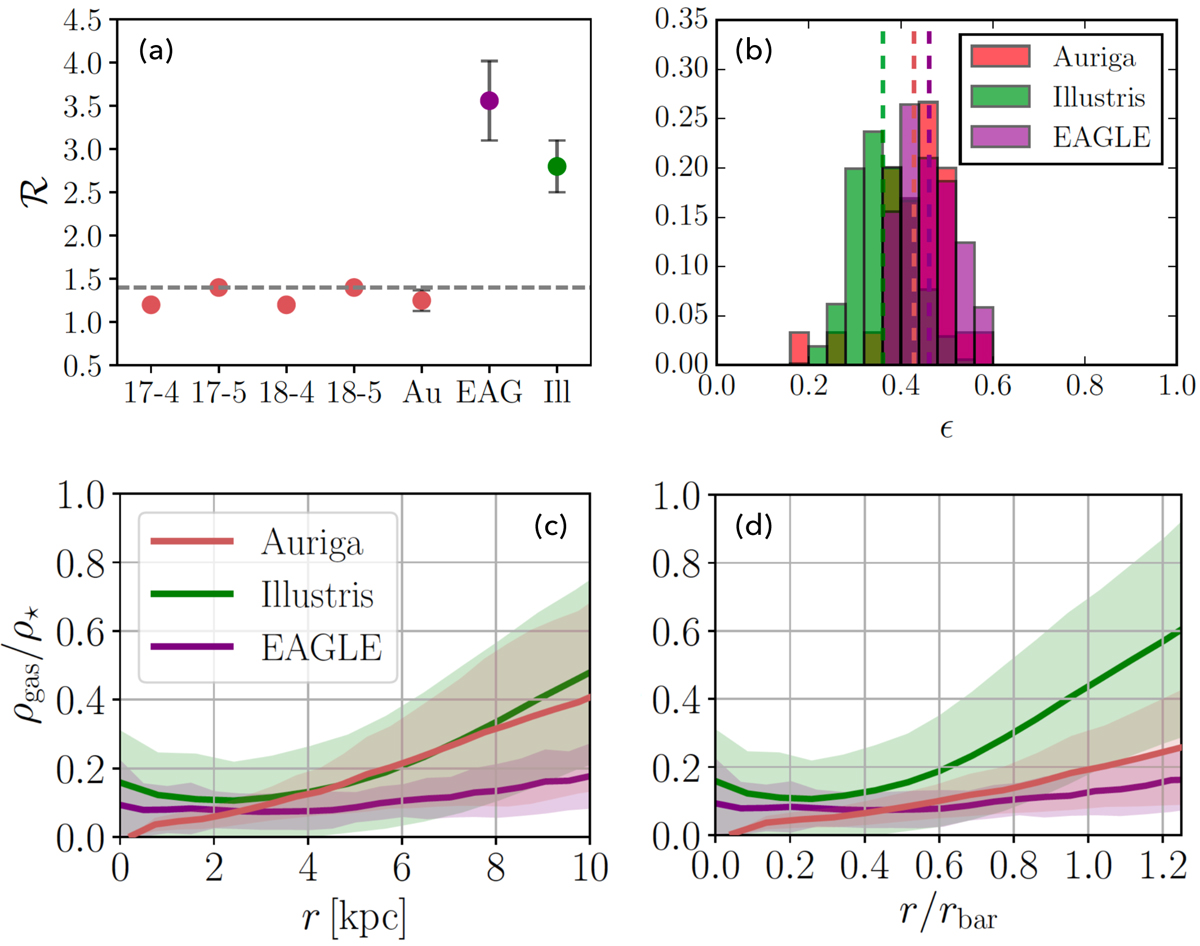
Comparing properties of discs in Auriga to those in EAGLE and Illustris. (a) Resolution test for ℛ: the value of ℛ for the two lower resolution runs (Au17-5 and Au18-5) compared to the standard resolution runs (Au17-4 and Au18-4). For reference, we also show the mean and 2σ error of ℛ for the whole bar sample of Auriga, EAGLE, and Illustris. (b) Disc thickness: the flattening, ϵ = 1 − c/a, of disc galaxies in Auriga, Illustris, and EAGLE. The average values of the distributions (vertical dashed lines) are 0.42, 0.36, and 0.46, respectively. (c) Gas fraction vs. radius: the average gas density over stellar density in the Auriga galaxies as compared to disc galaxies in EAGLE and Illustris. (d) Gas fraction vs. normalised radius: as in panel c, with the radius normalised by the average bar length in each of the simulations.
Current usage metrics show cumulative count of Article Views (full-text article views including HTML views, PDF and ePub downloads, according to the available data) and Abstracts Views on Vision4Press platform.
Data correspond to usage on the plateform after 2015. The current usage metrics is available 48-96 hours after online publication and is updated daily on week days.
Initial download of the metrics may take a while.