Fig. 1.
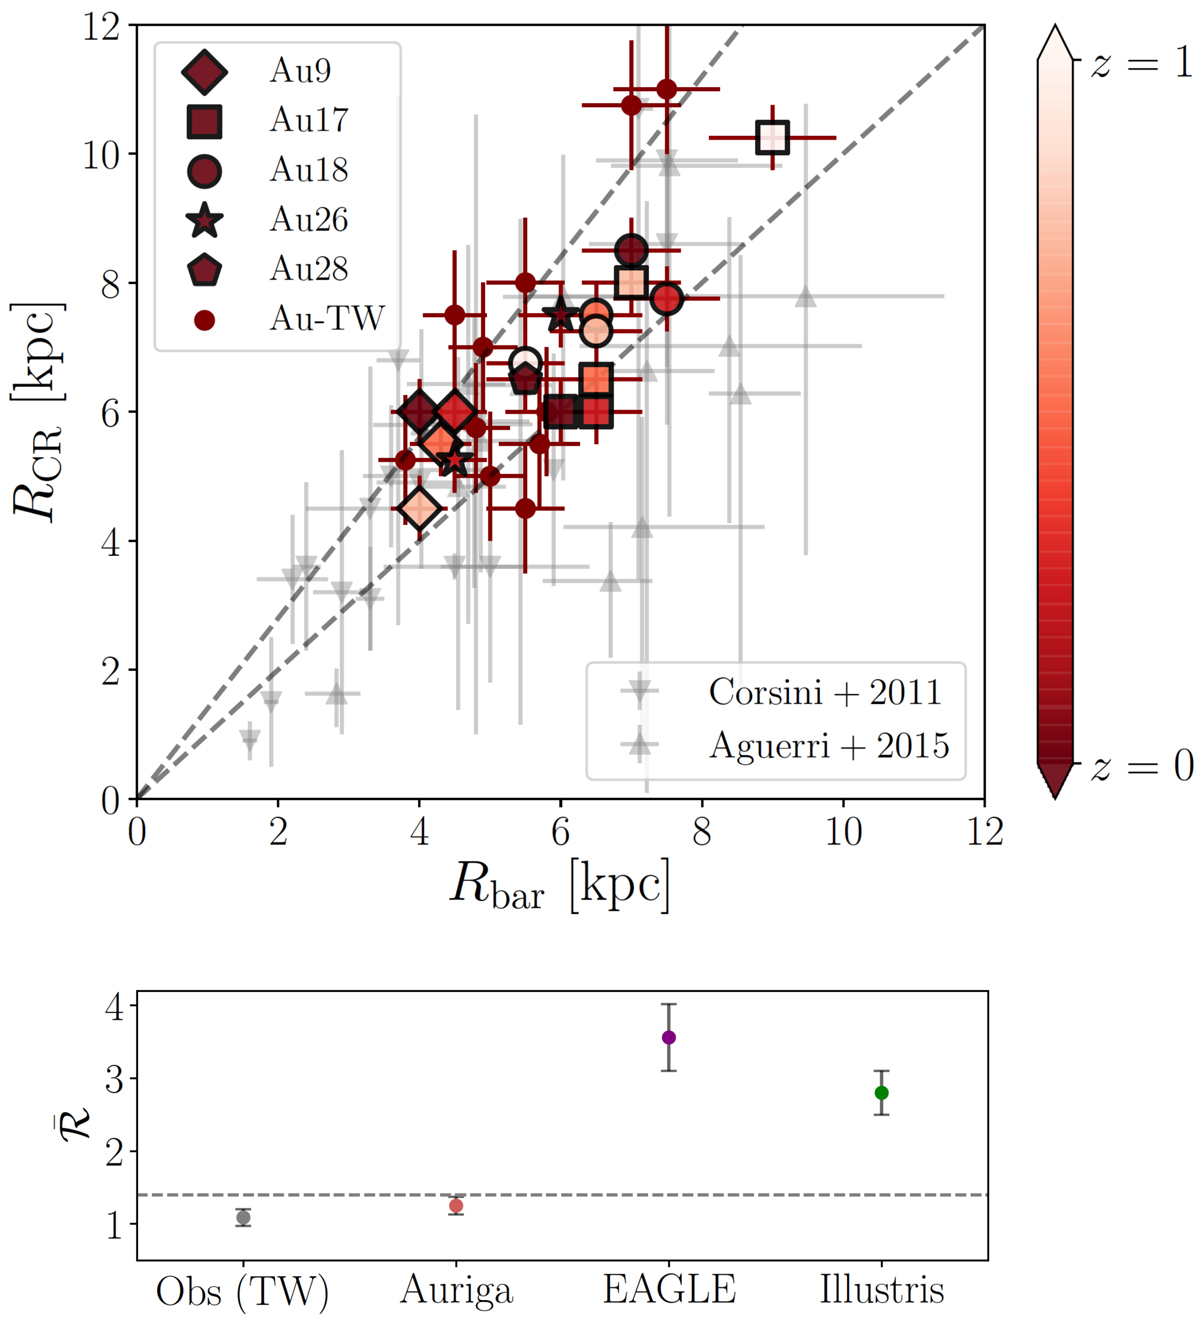
Bar corotation radius vs. bar length for Auriga galaxies. Top panel: corotation radius as a function of bar length for the barred Auriga galaxies, denoted by the symbols in the figure legend. The colour-coding corresponds to measurements at different redshifts, while for the galaxies for which we use the TW method (Au-TW) we estimate the pattern speed at z = 0. These are compared to data from Corsini (2011) and Aguerri et al. (2015) (grey points); the error bars indicate the 1σ uncertainties. The lower and upper dashed grey lines indicate ℛ = 1 and ℛ = 1.4, respectively. Bars in Auriga are fast across all redshifts. Bottom panel: mean ℛ for the aforementioned observations for barred galaxies in Auriga and for the EAGLE and Illustris barred galaxies from Algorry et al. (2017) and Peschken & Łokas (2019) at z = 0. The error bars indicate the 2σ error on the mean. The dashed line indicates ℛ = 1.4, below which bars are considered fast. Bars in the Auriga simulations are fast, compatible with observations, while bars in EAGLE and Illustris are excessively slow at z = 0.
Current usage metrics show cumulative count of Article Views (full-text article views including HTML views, PDF and ePub downloads, according to the available data) and Abstracts Views on Vision4Press platform.
Data correspond to usage on the plateform after 2015. The current usage metrics is available 48-96 hours after online publication and is updated daily on week days.
Initial download of the metrics may take a while.