Fig. 7.
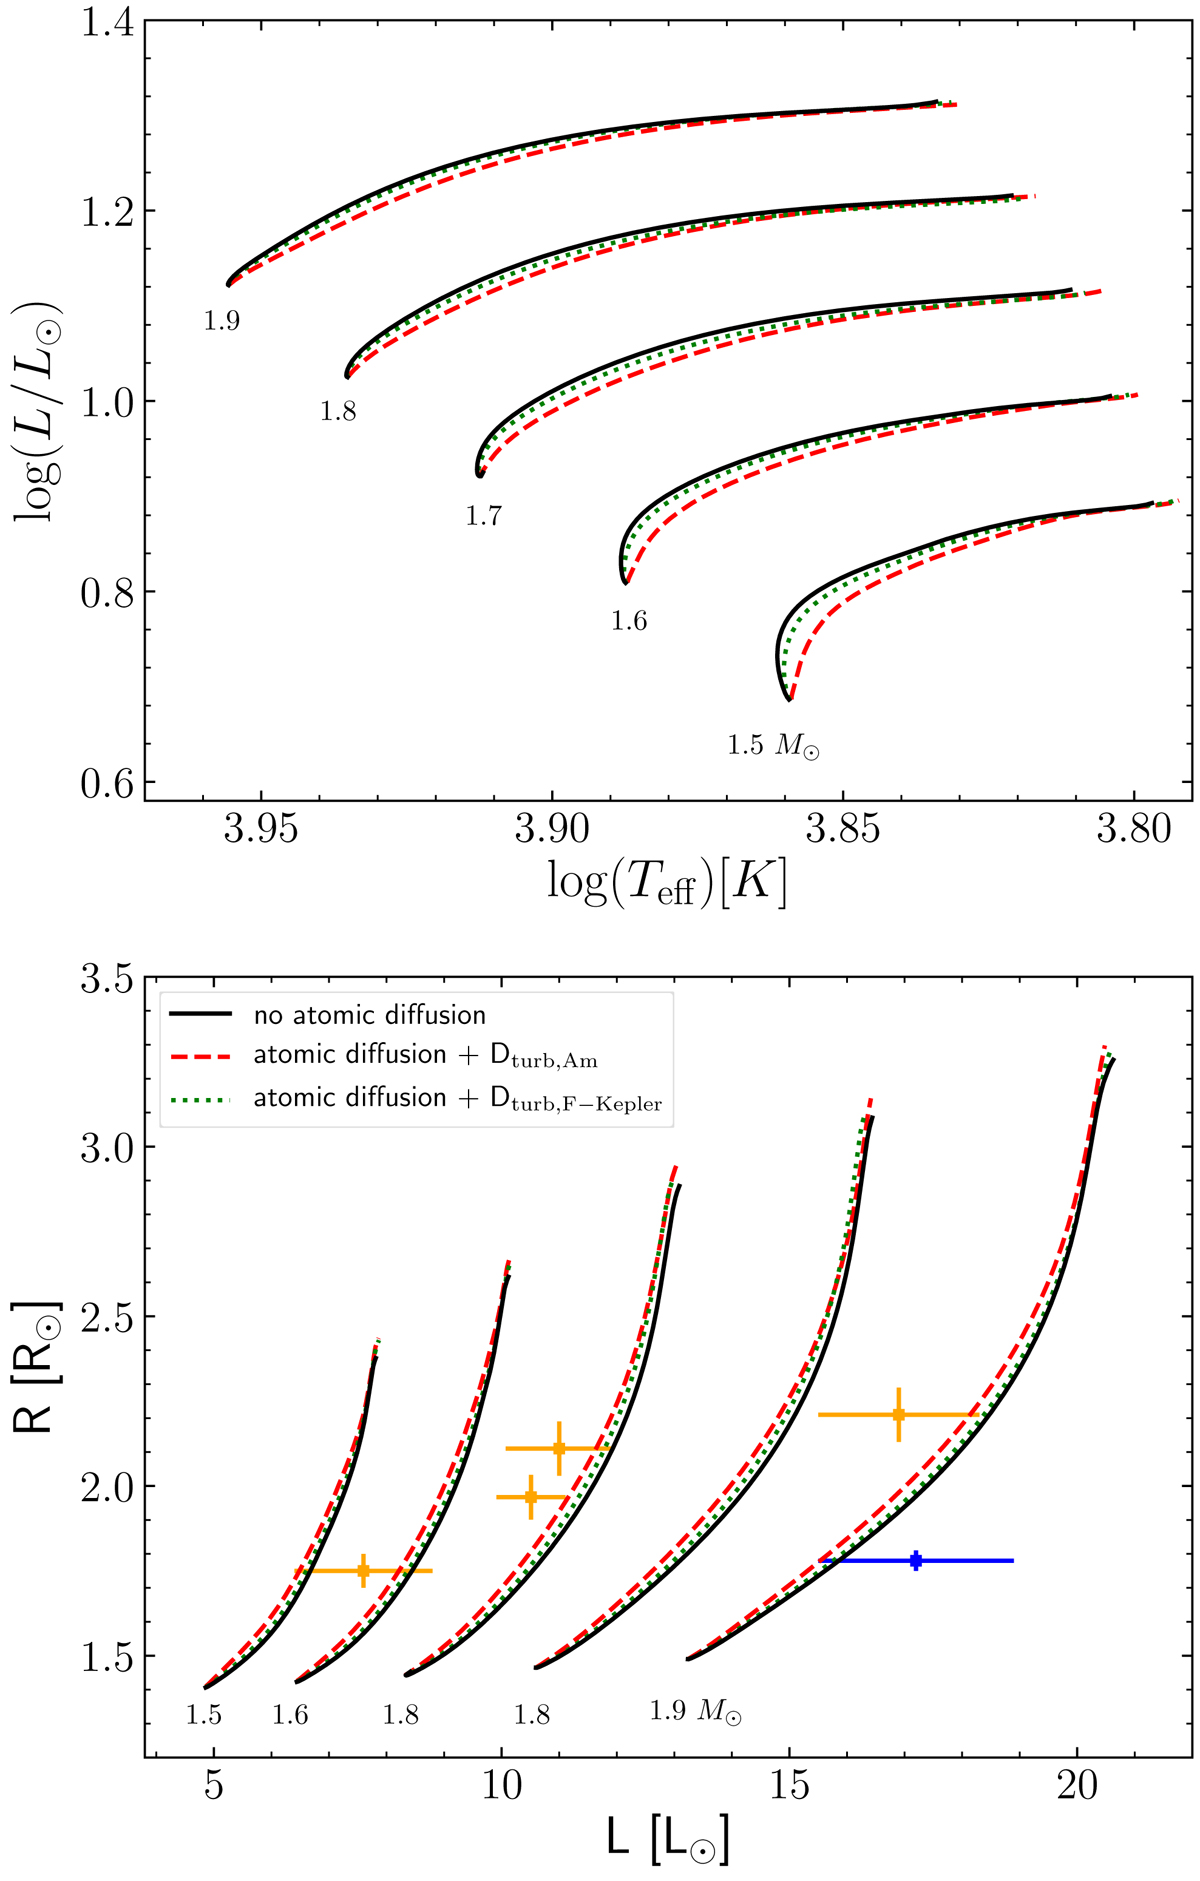
Top: HR diagram including evolutionary tracks for models with masses between 1.5 and 1.9 M⊙ computed without atomic diffusion (black solid lines), and including atomic diffusion (with radiative accelerations) with a parametrised turbulent diffusion coefficient calibrated on Am stars (red dashed lines) and on three Kepler F-type stars (green dotted lines). Bottom: radius according to luminosity for the models shown on the top panel. The blue and orange symbols are the same as in Fig. 1.
Current usage metrics show cumulative count of Article Views (full-text article views including HTML views, PDF and ePub downloads, according to the available data) and Abstracts Views on Vision4Press platform.
Data correspond to usage on the plateform after 2015. The current usage metrics is available 48-96 hours after online publication and is updated daily on week days.
Initial download of the metrics may take a while.