Fig. 6.
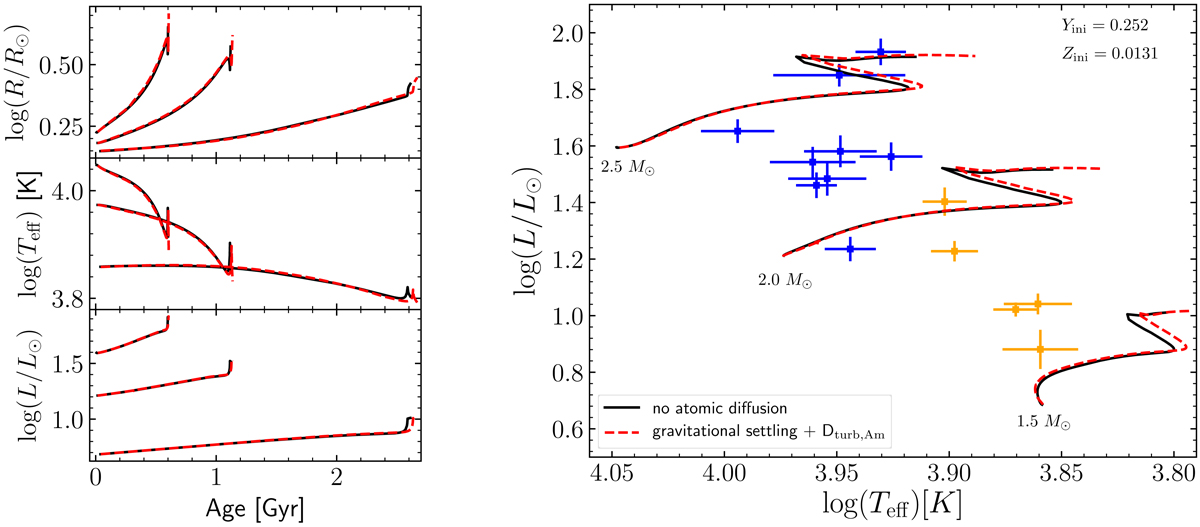
Shown are two sets of CESTAM evolutionary models. The first one (black solid lines) with the same physics as the model presented in the middle panel of Fig. 1 (representative physics of the grid used in this study). The second one (red dashed lines) including gravitational settling and a parametrised turbulent diffusion coefficient calibrated on Am stars (see text). The blue and orange crosses are the same as in Fig. 1.
Current usage metrics show cumulative count of Article Views (full-text article views including HTML views, PDF and ePub downloads, according to the available data) and Abstracts Views on Vision4Press platform.
Data correspond to usage on the plateform after 2015. The current usage metrics is available 48-96 hours after online publication and is updated daily on week days.
Initial download of the metrics may take a while.