Fig. 1.
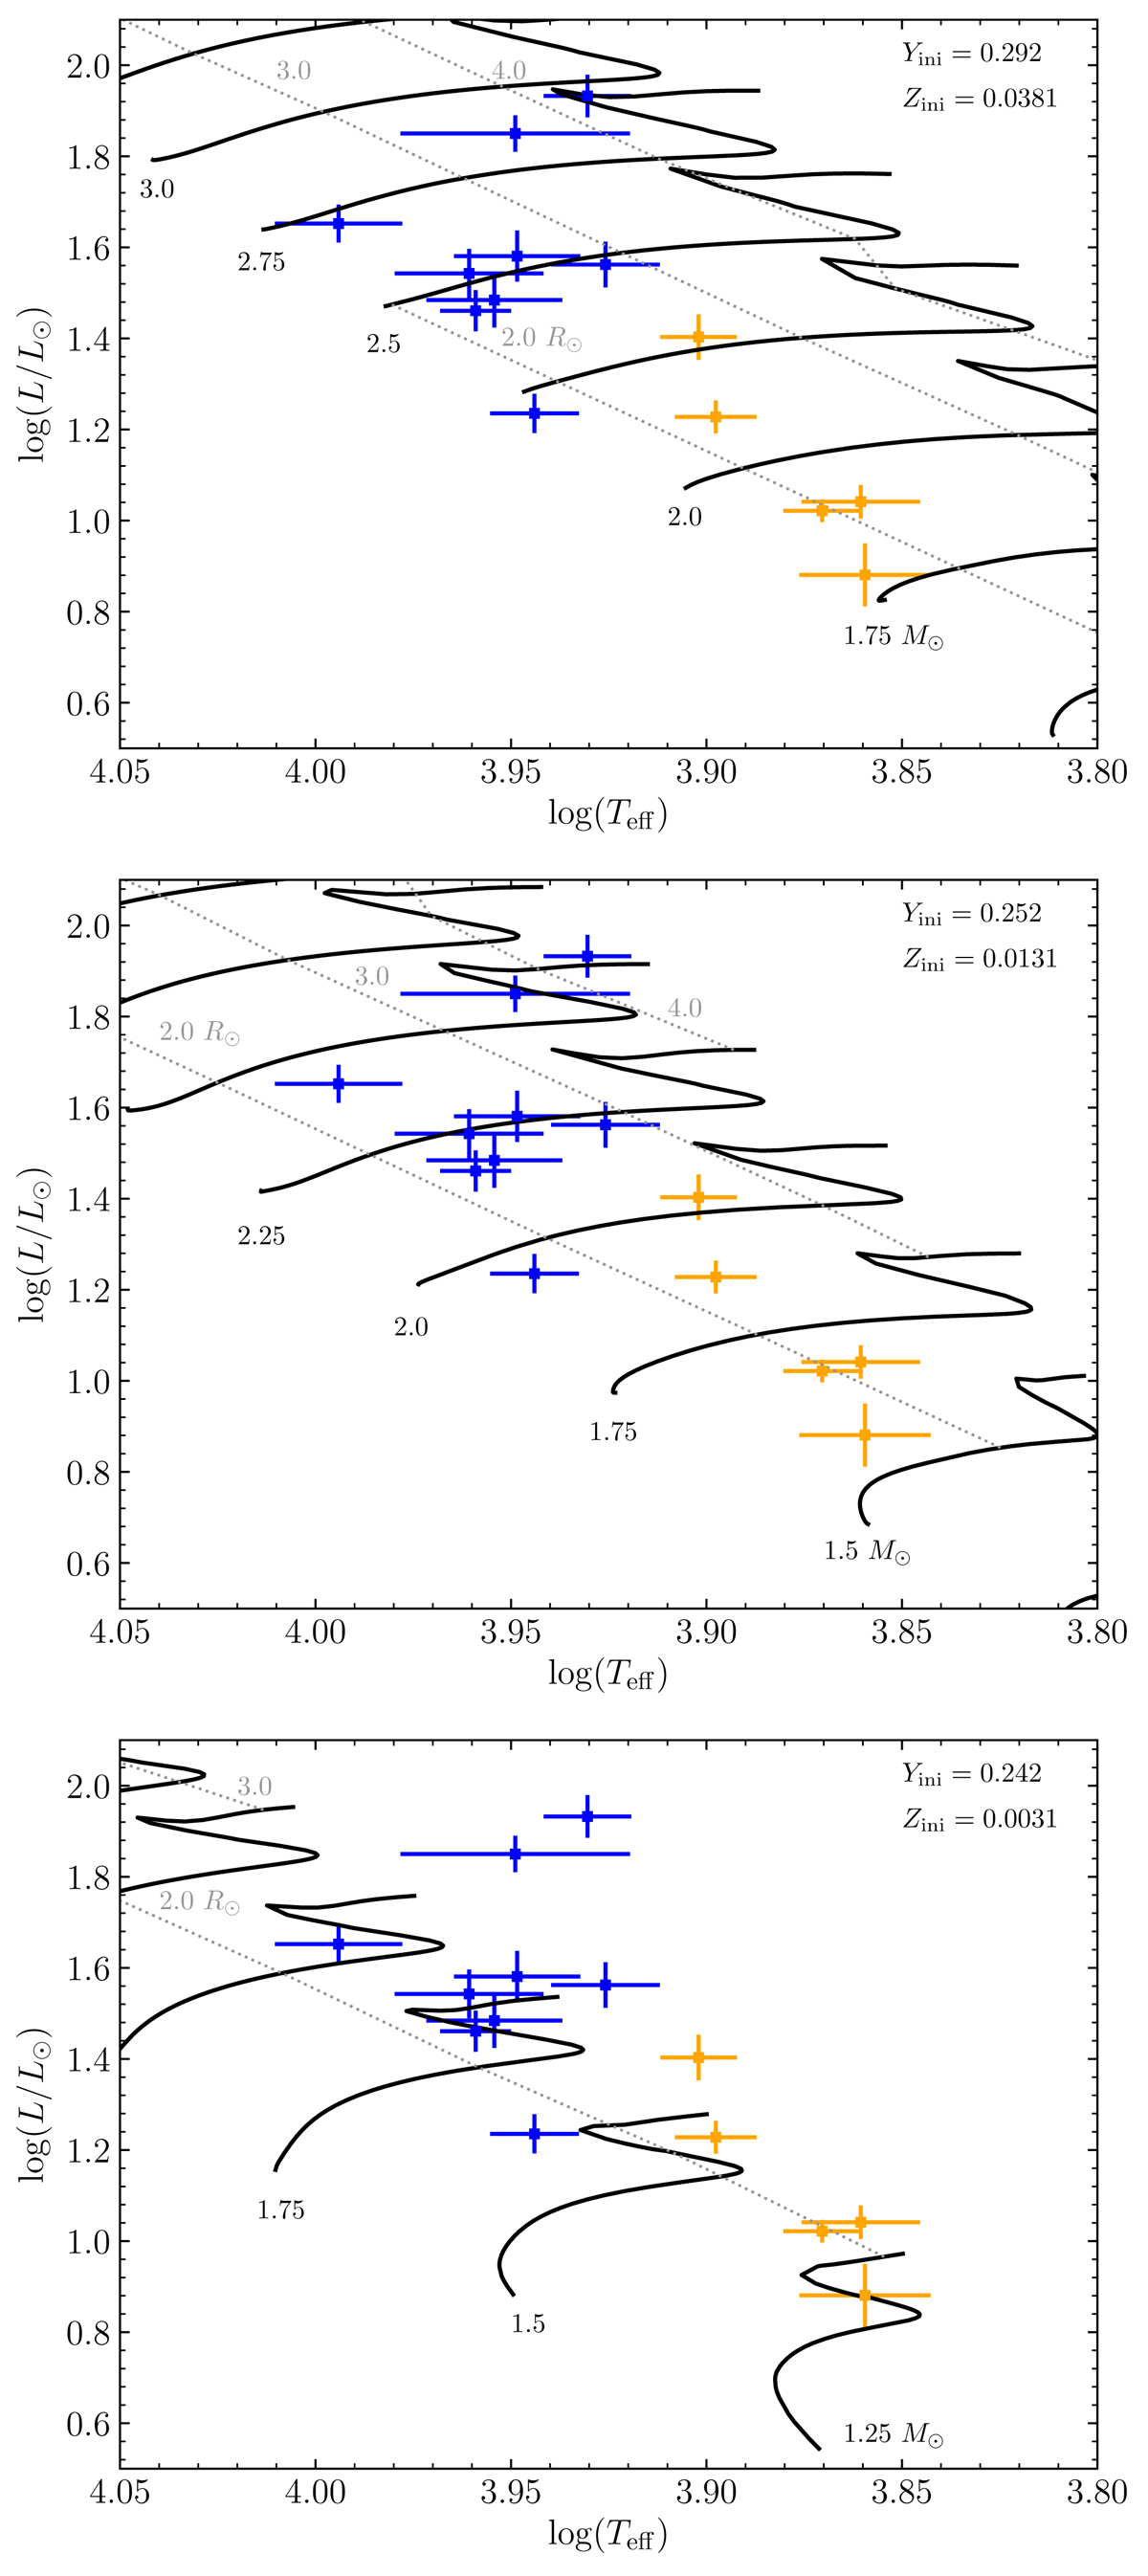
HR diagram including the studied stars listed in Table 1 and evolutionary tracks for masses between 1.25 and 3.25 M⊙ at different initial chemical composition (black solid lines). Orange crosses are roAp stars while the blue ones are the other star of the sample. The dotted lines represent the iso-radius at 2.0, 3.0, and 4.0 R⊙. See the text for details about the models.
Current usage metrics show cumulative count of Article Views (full-text article views including HTML views, PDF and ePub downloads, according to the available data) and Abstracts Views on Vision4Press platform.
Data correspond to usage on the plateform after 2015. The current usage metrics is available 48-96 hours after online publication and is updated daily on week days.
Initial download of the metrics may take a while.