Open Access
Fig. 9
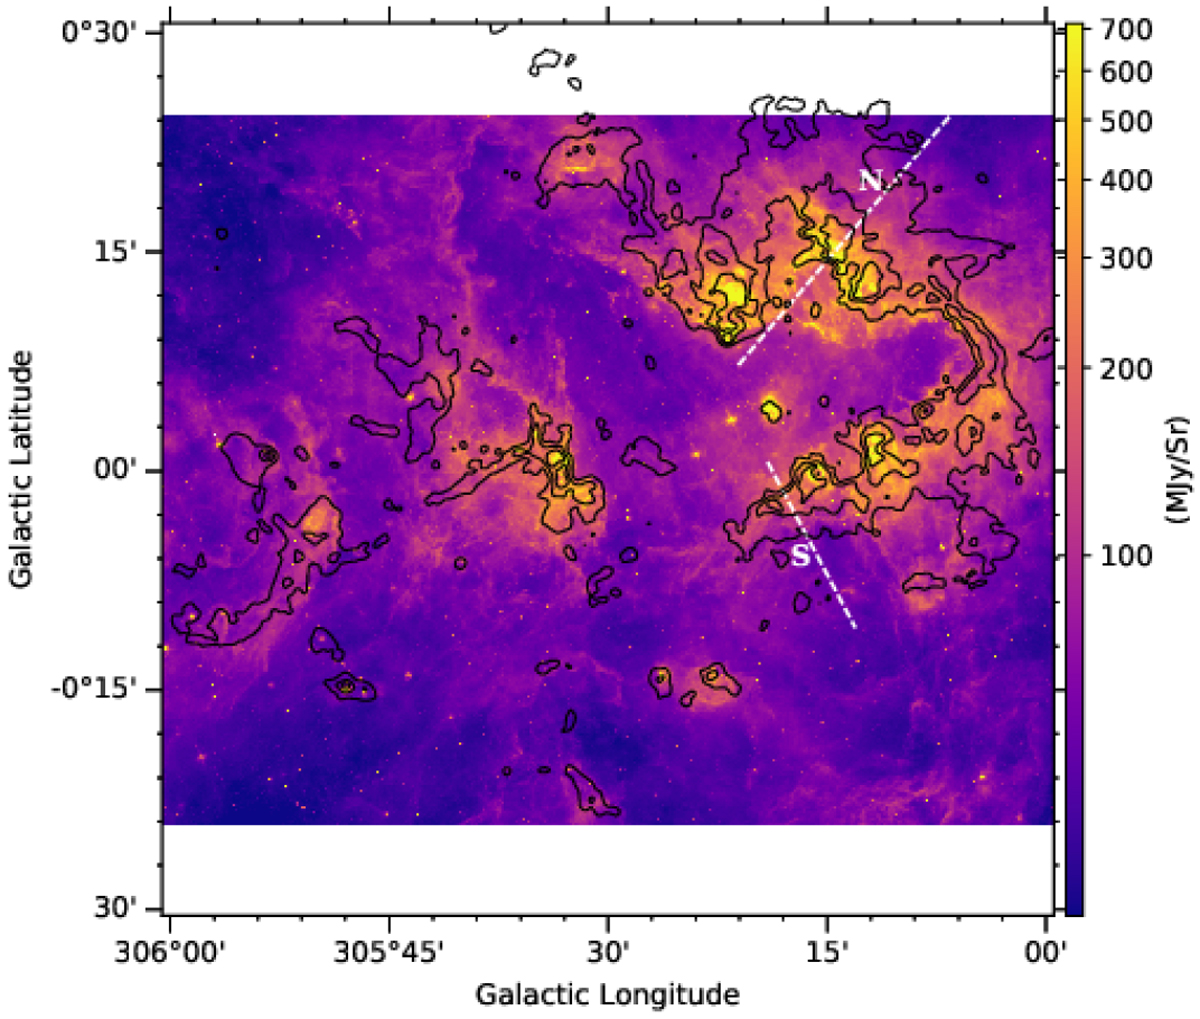
GLIMPSE 8 μm map of the G305 regions. The black contours correspond to the 12CO J = 3–2 integrated intensities of 30, 70, and 120 K km s−1 (50, 120, and200σ, respectively). The dashed lines show the direction along which the profiles of the excitation ratio was plotted in Fig. 6.
Current usage metrics show cumulative count of Article Views (full-text article views including HTML views, PDF and ePub downloads, according to the available data) and Abstracts Views on Vision4Press platform.
Data correspond to usage on the plateform after 2015. The current usage metrics is available 48-96 hours after online publication and is updated daily on week days.
Initial download of the metrics may take a while.