Fig. 7
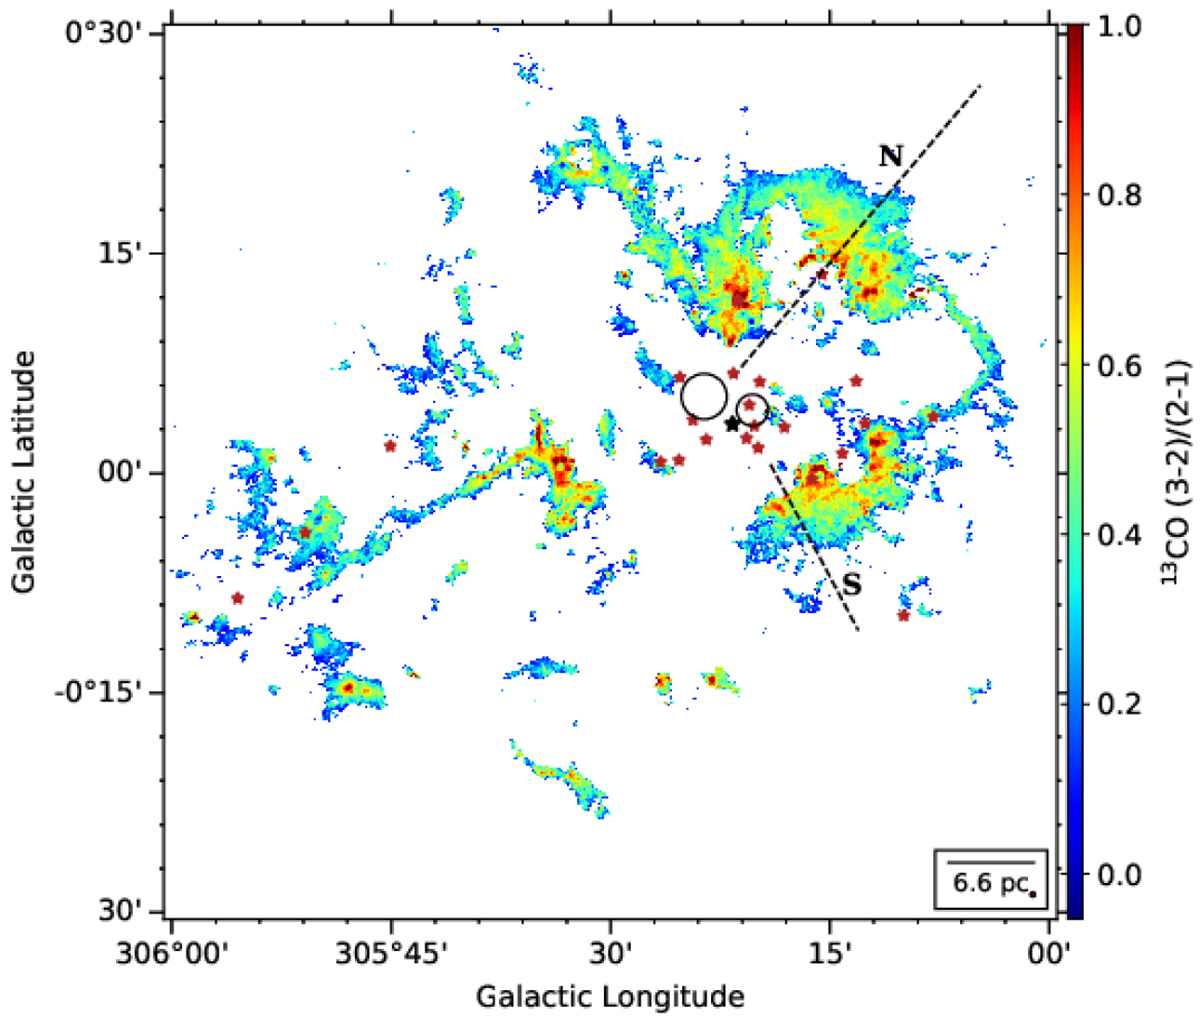
13CO J = 3− 2/J = 2−1 ratio map of the G305 complex. The dashed lines show the direction along which the profiles of the excitation ratio was plotted in Fig. 6. The black circles show the locations of the Danks 1 and 2 clusters. The black star shows the position of WR48a, and the red stars show the positions of the stars from Borissova et al. (2019).
Current usage metrics show cumulative count of Article Views (full-text article views including HTML views, PDF and ePub downloads, according to the available data) and Abstracts Views on Vision4Press platform.
Data correspond to usage on the plateform after 2015. The current usage metrics is available 48-96 hours after online publication and is updated daily on week days.
Initial download of the metrics may take a while.