Fig. 5
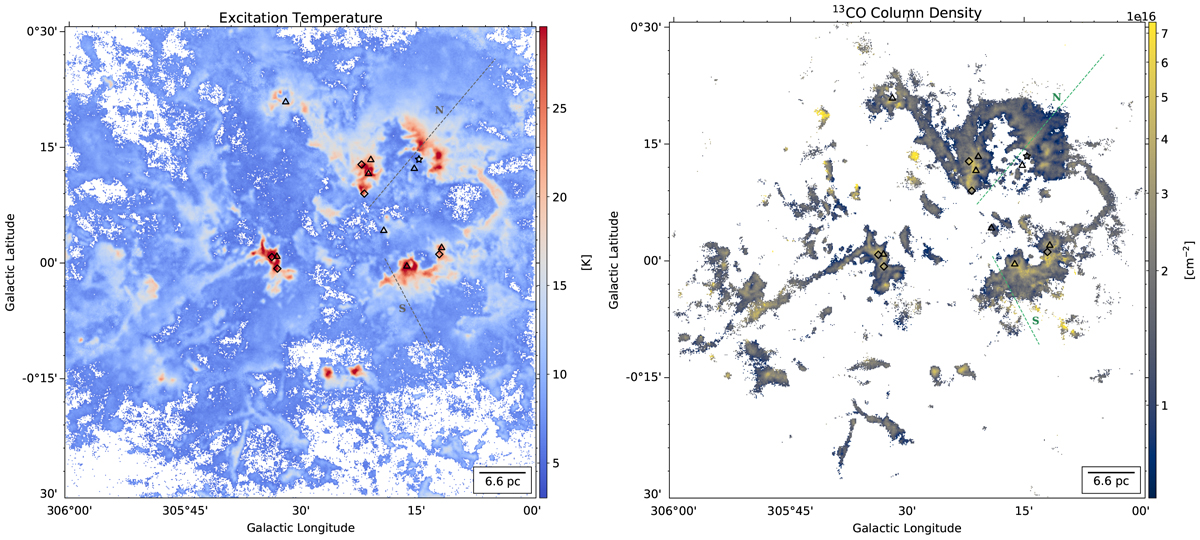
Left: mean Tex map of the G305 complex. For each pixel this was calculated by integrating over all the channels. Only those channels that had emissionabove 5σ noise level were considered. Right: integrated 13CO Column Density map of G305. This was calculated by summing the 13CO total column density per channel over all the channels. Overlaid on top, are the positions of the HII regions (triangles), UC HII regions (diamonds), and the BRC (star) as determined by Hindson et al. (2012, 2013).
Current usage metrics show cumulative count of Article Views (full-text article views including HTML views, PDF and ePub downloads, according to the available data) and Abstracts Views on Vision4Press platform.
Data correspond to usage on the plateform after 2015. The current usage metrics is available 48-96 hours after online publication and is updated daily on week days.
Initial download of the metrics may take a while.