Fig. 15
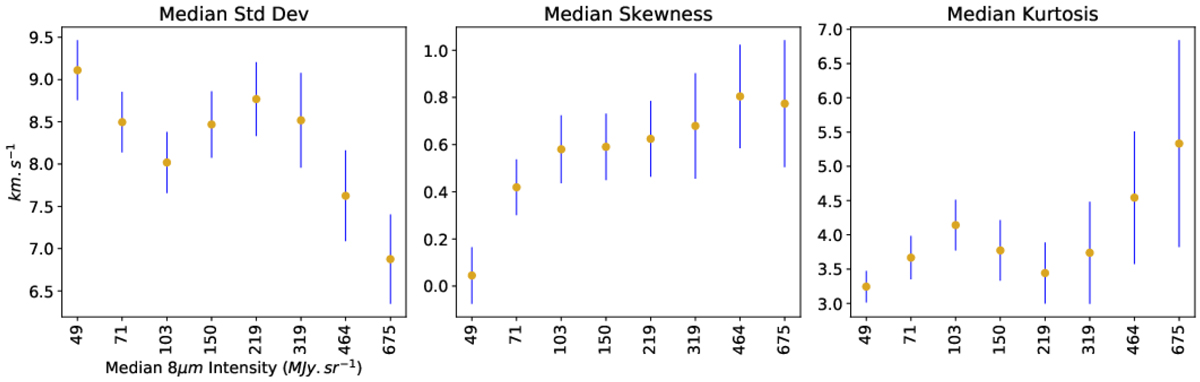
Variance (left panel), skewness (middle panel), and Kurtosis (right panel) of stacked spectra corresponding to GLIMPSE 8 μm flux intervalsin Fig. 14 as a function of the median 8 μm flux for that interval. The golden circles represent the median of the distribution and the blue lines span the 5 to 95 percentile range of values for each set of 500 iterations per interval.
Current usage metrics show cumulative count of Article Views (full-text article views including HTML views, PDF and ePub downloads, according to the available data) and Abstracts Views on Vision4Press platform.
Data correspond to usage on the plateform after 2015. The current usage metrics is available 48-96 hours after online publication and is updated daily on week days.
Initial download of the metrics may take a while.