Fig. 14
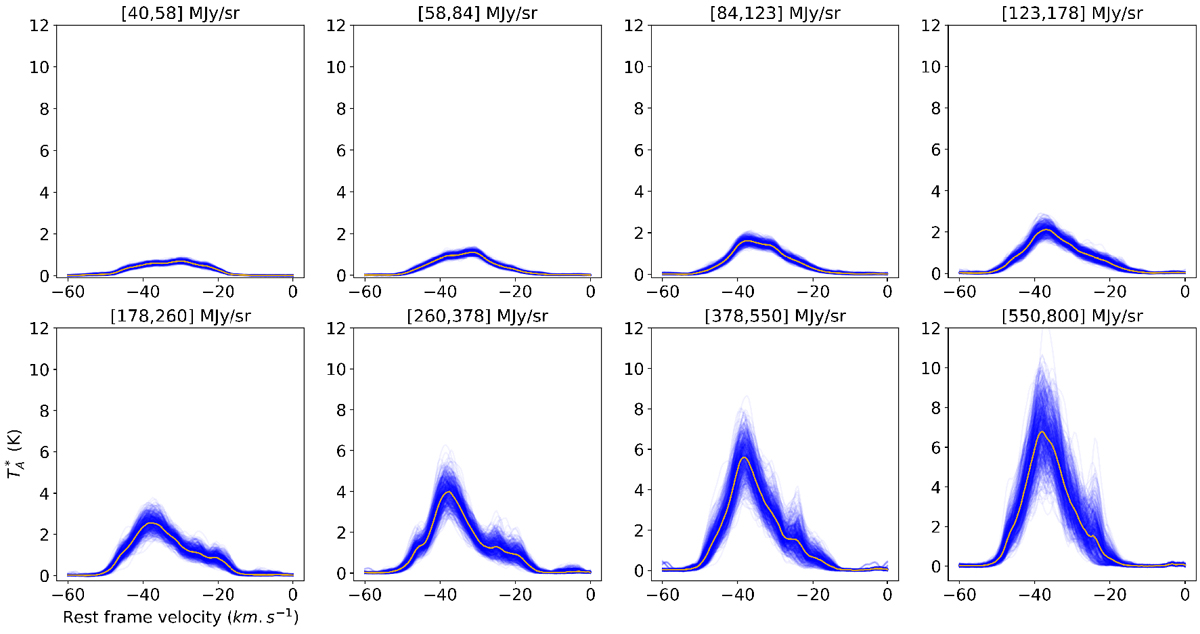
Stacked spectra for regions corresponding to different choices of GLIMPSE 8 μm flux intervals. Each interval subplot consists of 500 stacked spectra (translucent blue), each corresponding to randomly selected pixels from the region. The golden spectra in each subplot corresponds to the median spectra for that interval obtained by taking the median channel intensity for each channel. The interval values are given on top of each subplot.
Current usage metrics show cumulative count of Article Views (full-text article views including HTML views, PDF and ePub downloads, according to the available data) and Abstracts Views on Vision4Press platform.
Data correspond to usage on the plateform after 2015. The current usage metrics is available 48-96 hours after online publication and is updated daily on week days.
Initial download of the metrics may take a while.