Fig. 13
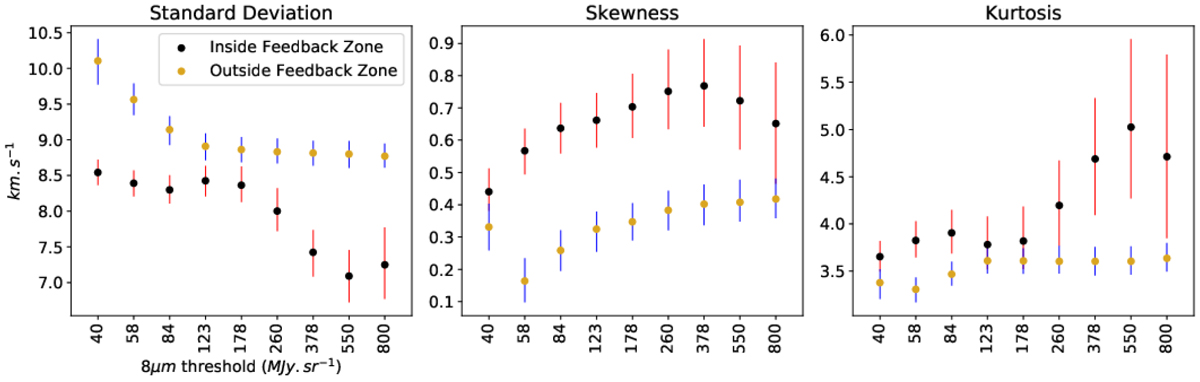
Variance (left panel), skewness (middle panel), and Kurtosis (right panel) of stacked spectra corresponding to “inside-” (black dots with red bars) and “outside feedback zones” (golden dots with blue bars) in Fig. 12 as a function of GLIMPSE 8 μm flux thresholds. The dots represent the median value and the bars span the 25–75 percentile spread of values from the 500 iterations for each threshold value.
Current usage metrics show cumulative count of Article Views (full-text article views including HTML views, PDF and ePub downloads, according to the available data) and Abstracts Views on Vision4Press platform.
Data correspond to usage on the plateform after 2015. The current usage metrics is available 48-96 hours after online publication and is updated daily on week days.
Initial download of the metrics may take a while.