Fig. 12
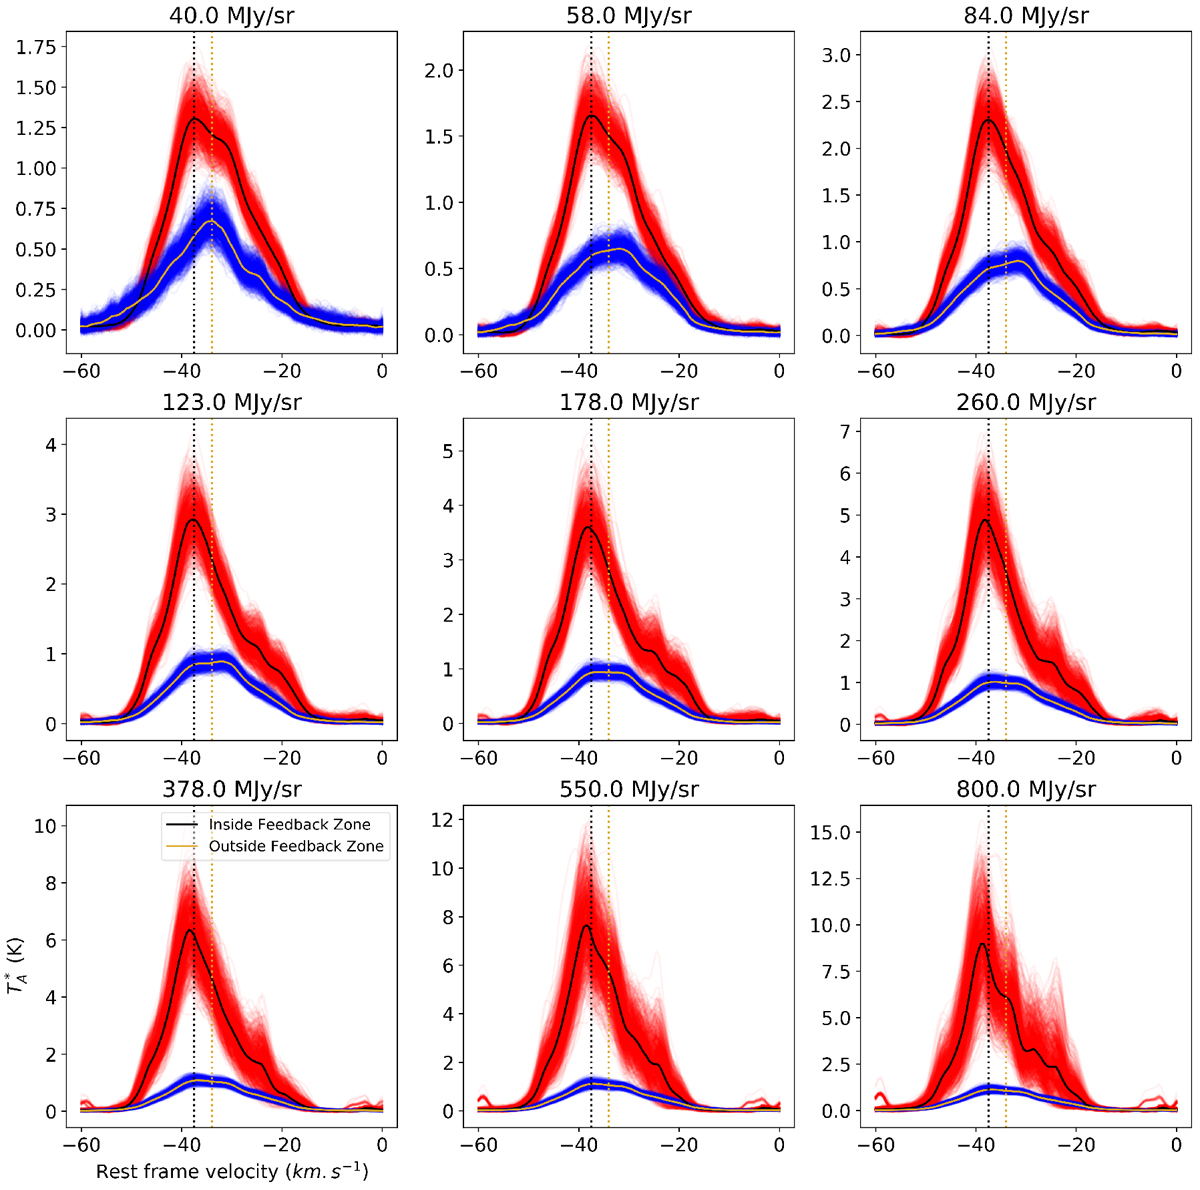
Stacked spectra of 12CO(J = 3–2) emission corresponding to the “inside-” (translucent red) and “outside feedback zones” (translucent blue) for different choices of GLIMPSE 8 μm flux thresholds (specified on top of each subplot). Each subplot consists of 500 stacked spectra each for both zones obtained by randomly selecting the square root of the total number of pixels from each zone. The black and golden spectra for each zone were obtained by calculating the median value for each channel over the 500 iterations performed. The black (golden) dotted line in all the subplots correspond to the position of peak emission of the median stacked spectra inside (outside) the feedback zone corresponding to the threshold of 40 MJy ∕sr.
Current usage metrics show cumulative count of Article Views (full-text article views including HTML views, PDF and ePub downloads, according to the available data) and Abstracts Views on Vision4Press platform.
Data correspond to usage on the plateform after 2015. The current usage metrics is available 48-96 hours after online publication and is updated daily on week days.
Initial download of the metrics may take a while.