Fig. 10
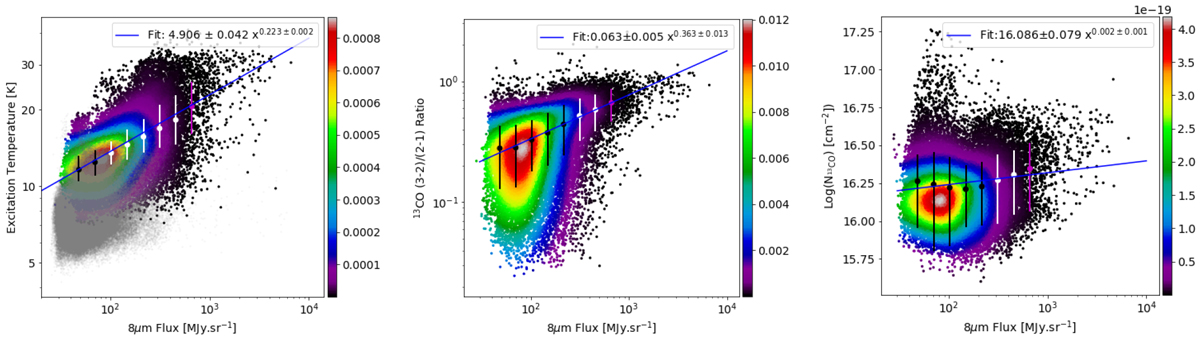
Pixel by pixel scatter plot of different gas properties versus 8 μm flux. The colors represents the probability density of the scatter points obtained by a kernel density estimate using Gaussian kernels. Overlaid on top are the mean values of the quantity probed along with their standard deviations plotted as a function of 8 μm flux. The blue line shows the power law fit to the mean values vs 8 μm flux. The results of the fit are shown at the top right corner of each panel. The gray translucent scatter points in the excitation temperature plot (left) correspond to the pixels which do not have a corresponding 13CO detection and are not included in the power law fit.
Current usage metrics show cumulative count of Article Views (full-text article views including HTML views, PDF and ePub downloads, according to the available data) and Abstracts Views on Vision4Press platform.
Data correspond to usage on the plateform after 2015. The current usage metrics is available 48-96 hours after online publication and is updated daily on week days.
Initial download of the metrics may take a while.