Fig. 9.
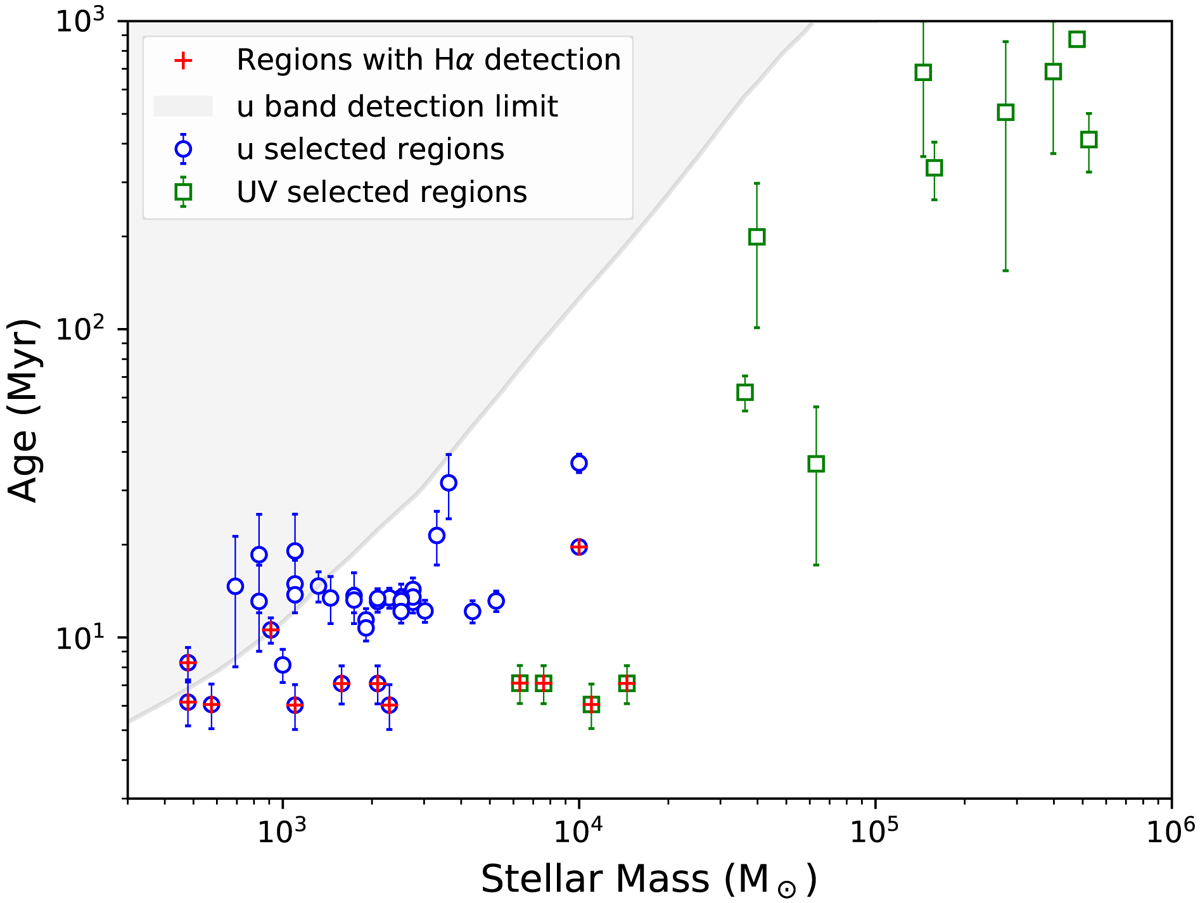
Age and stellar mass determined for all our selected regions. The blue circles and green squares represent u-band- and UV-selected regions, respectively. The gray shaded area is our u-band detection limit (lower mass or older clusters in the this area would not be detected based on the luminosity predicted by the Starburst99 models). The red crosses identify the Hα detected regions.
Current usage metrics show cumulative count of Article Views (full-text article views including HTML views, PDF and ePub downloads, according to the available data) and Abstracts Views on Vision4Press platform.
Data correspond to usage on the plateform after 2015. The current usage metrics is available 48-96 hours after online publication and is updated daily on week days.
Initial download of the metrics may take a while.