Fig. 8.
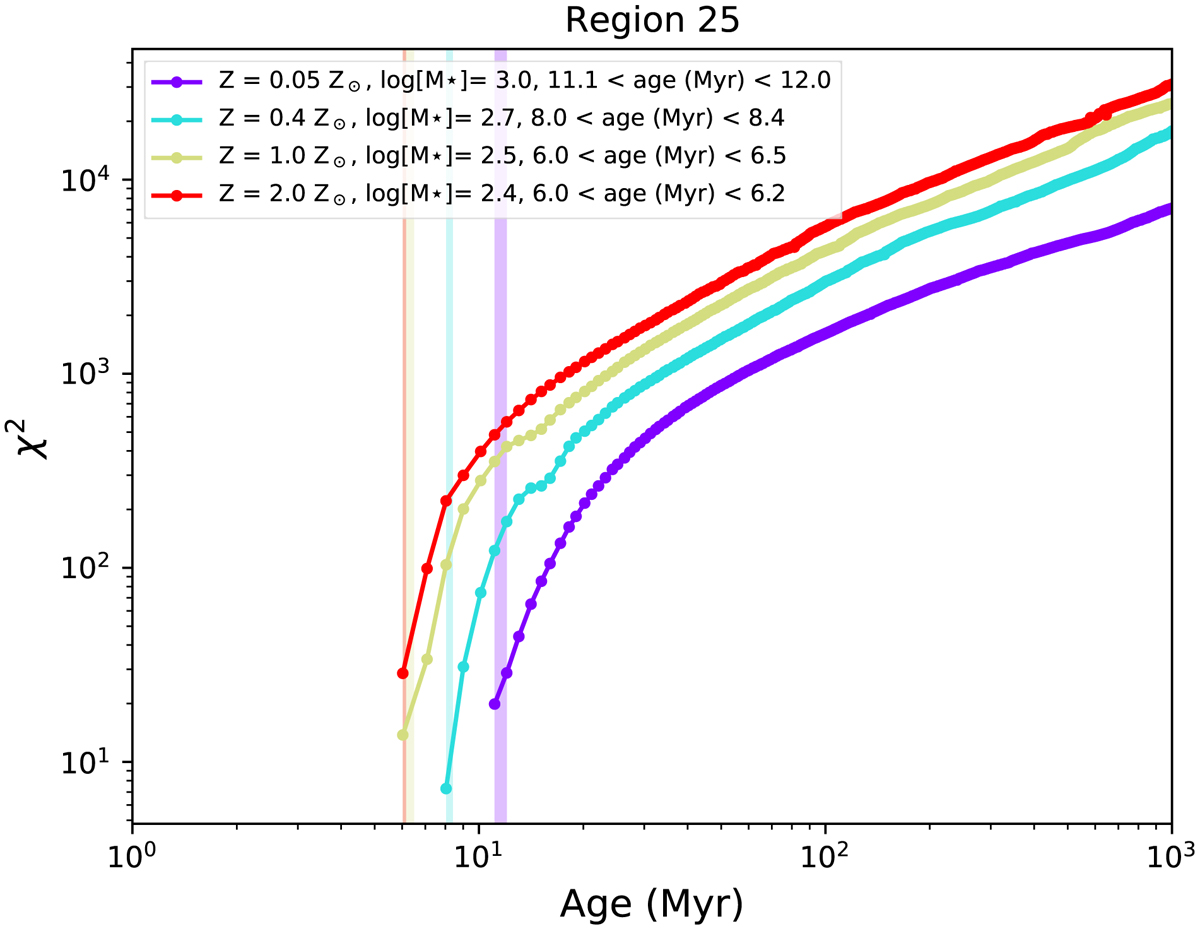
Example of the χ2 distribution for determination of the stellar mass, the age and the metallicity of region 25. The confidence limits around the best-fit ages (3σ), indicated by the vertical bands, are obtained from the given χ2 distribution following Avni (1976). We note that all the models with an age of less than 6 Myr for this region are rejected due to upper limit violations, resulting in the unusual single-sided χ2 distribution above (the other side could be represented by a vertical line if we assign artificially infinite χ2 to rejected models). Similar χ2 distributions for all the other regions are provided in Appendix A.
Current usage metrics show cumulative count of Article Views (full-text article views including HTML views, PDF and ePub downloads, according to the available data) and Abstracts Views on Vision4Press platform.
Data correspond to usage on the plateform after 2015. The current usage metrics is available 48-96 hours after online publication and is updated daily on week days.
Initial download of the metrics may take a while.