Fig. 5.
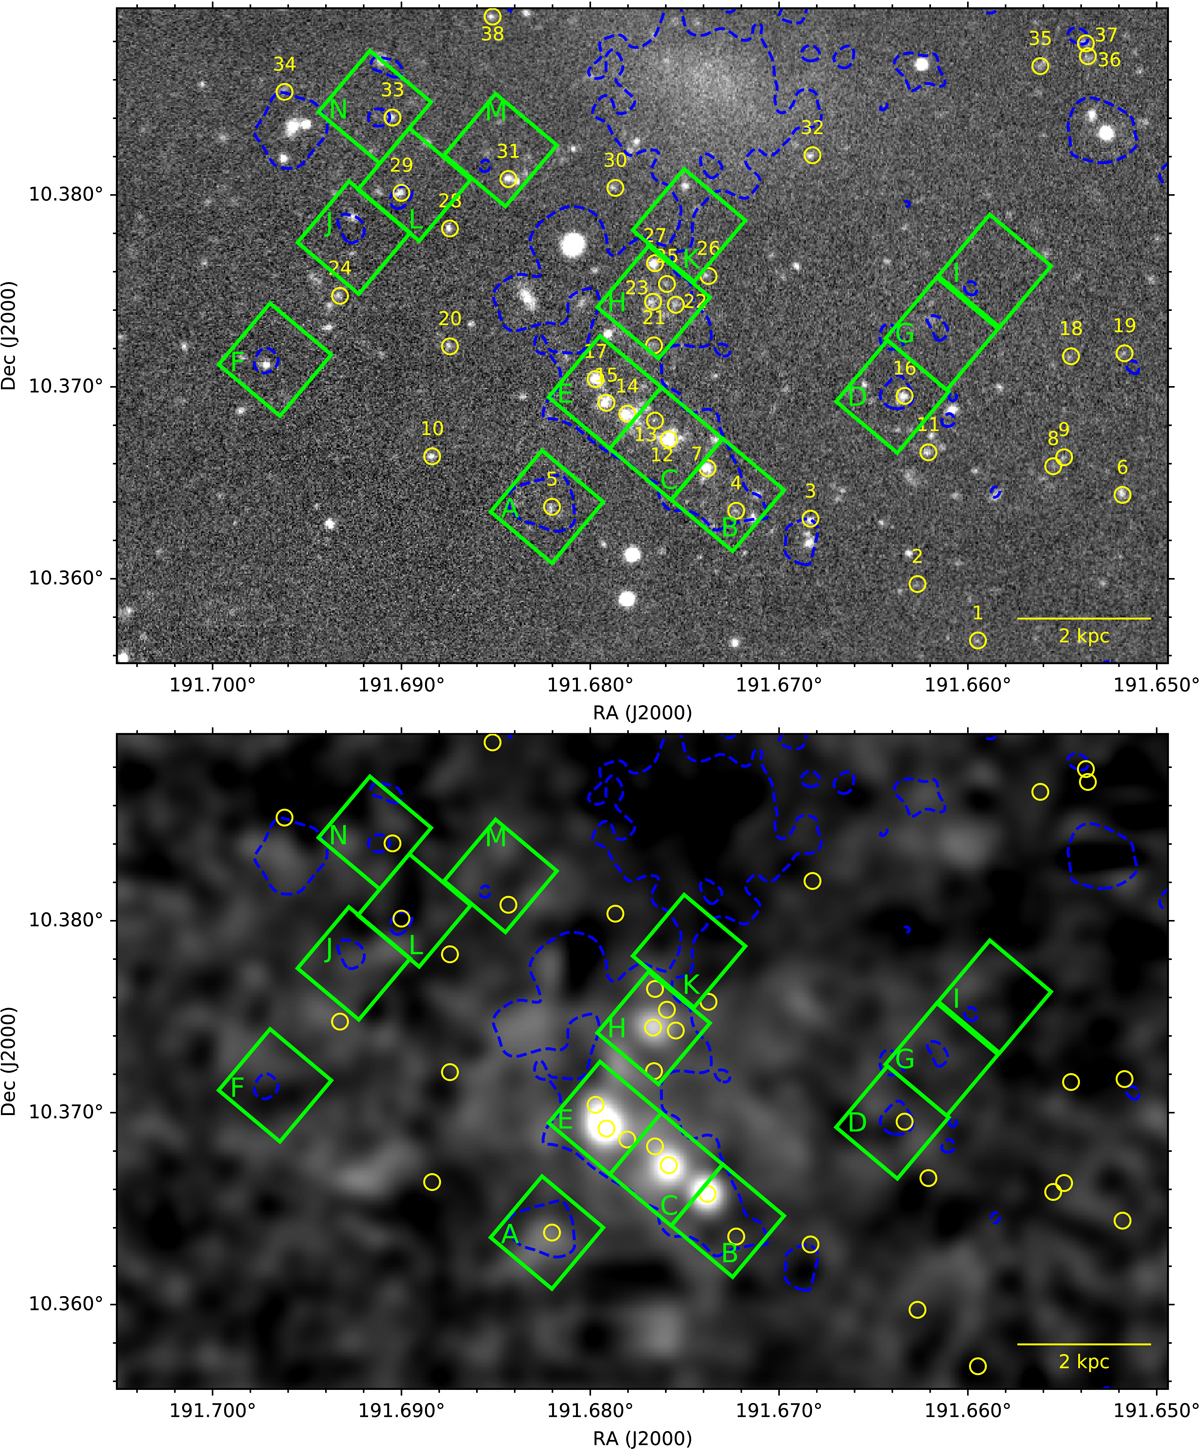
Top:u-band grayscale image along the area selected for our analysis. Bottom: VESTIGE continuum-subtracted Hα image smoothed at the resolution of GALEX. The yellow circles and the green boxes, marked with their names, are respectively our u-band-selected and UV-selected regions, as labeled in Table 3. The region names are attributed based on increasing declination. The blue dashed lines are the same NUV contours from GALEX as shown in Fig. 1.
Current usage metrics show cumulative count of Article Views (full-text article views including HTML views, PDF and ePub downloads, according to the available data) and Abstracts Views on Vision4Press platform.
Data correspond to usage on the plateform after 2015. The current usage metrics is available 48-96 hours after online publication and is updated daily on week days.
Initial download of the metrics may take a while.