Open Access
Fig. 3.
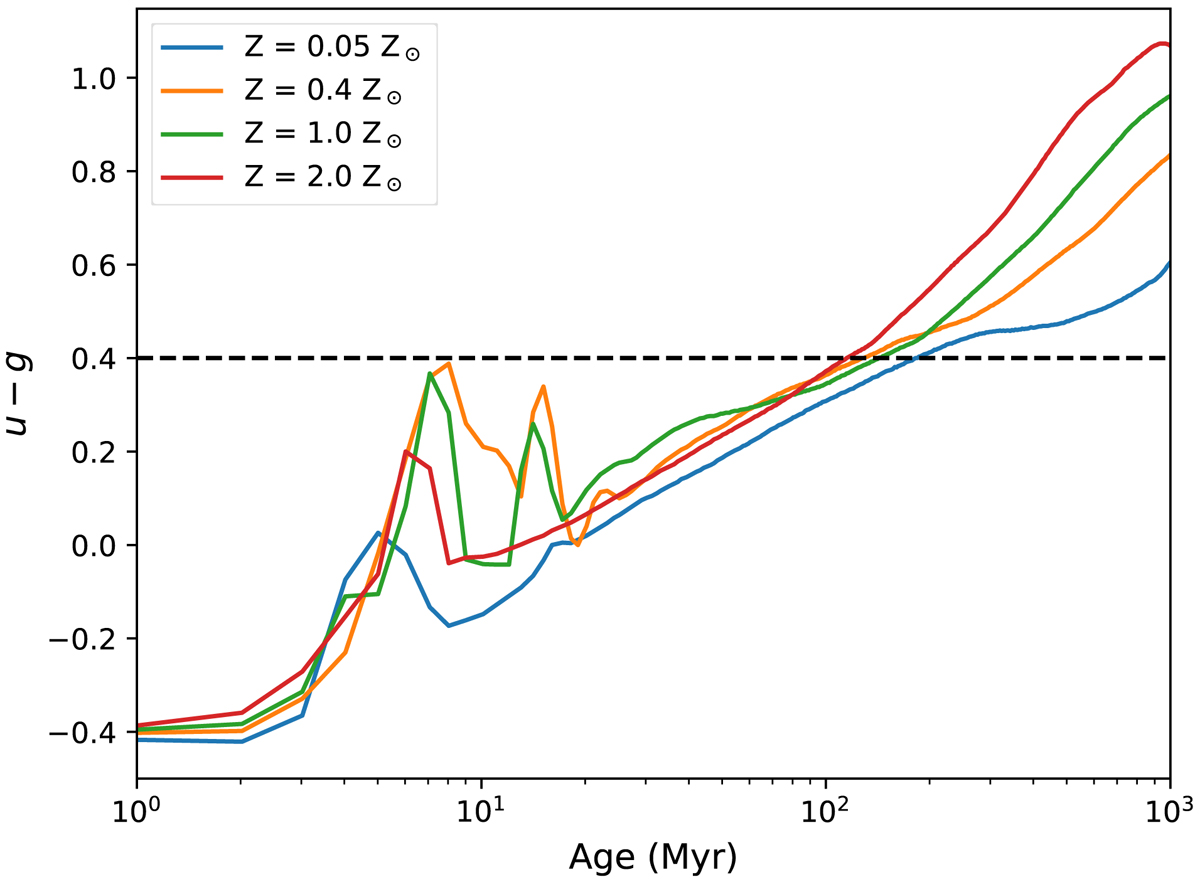
u − g color evolution of a single-burst population derived using Starburst99 models (Leitherer et al. 1999) for different metallicities. The black dashed line marks the u − g color limit (corresponding to an approximate age of less than 100 Myr) we adopted for the selection of young regions discussed in Sect. 2.3.1.
Current usage metrics show cumulative count of Article Views (full-text article views including HTML views, PDF and ePub downloads, according to the available data) and Abstracts Views on Vision4Press platform.
Data correspond to usage on the plateform after 2015. The current usage metrics is available 48-96 hours after online publication and is updated daily on week days.
Initial download of the metrics may take a while.