Fig. 11.
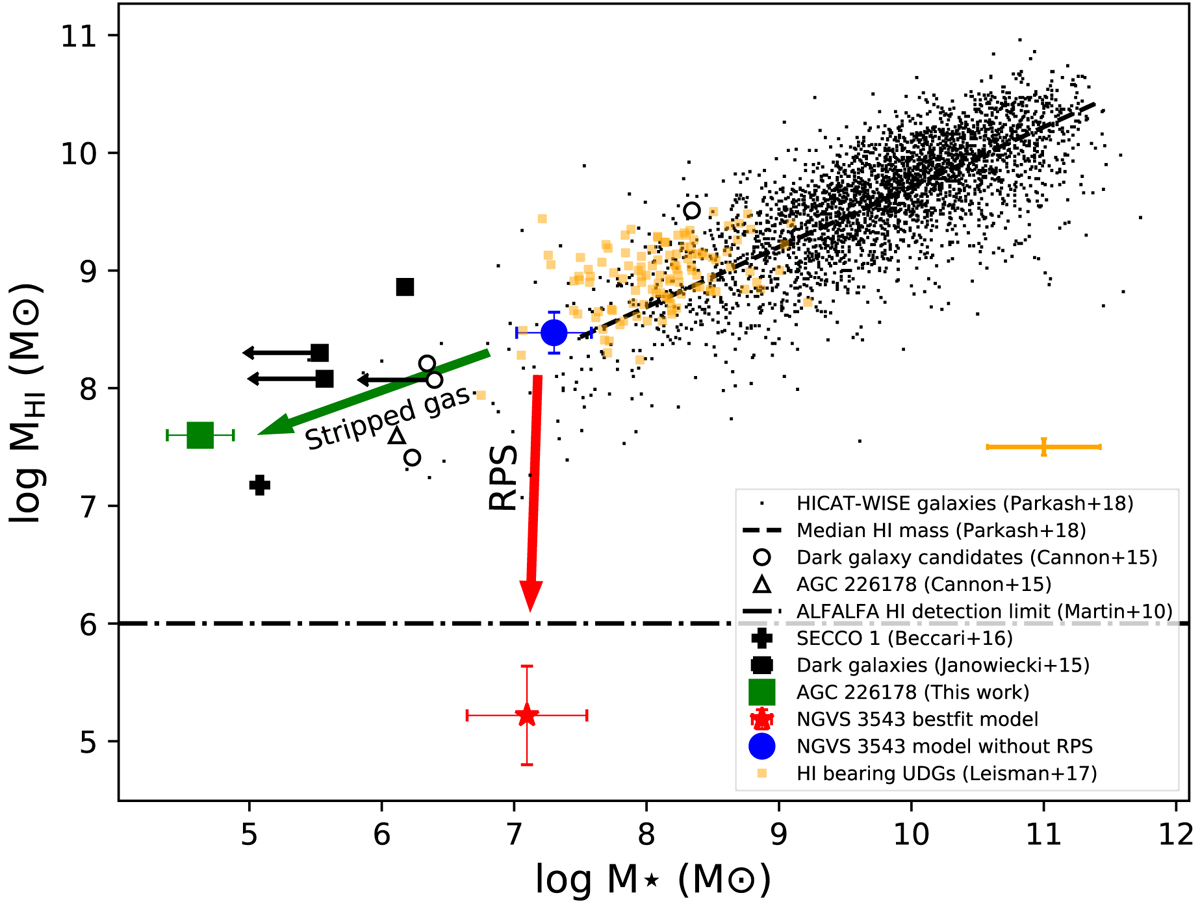
Stellar mass vs. HI mass of the HI-selected sample of spirals, UDGs and “dark” galaxies. The blue circle and the red star respectively mark the position of NGVS 3543 before and after the RPS event, as given in Table 4. The total gas masses from the models were converted into HI by multiplying by a factor 0.74 to take into account Helium and metals. Part of the stripped gas from the UDG can form AGC 226178, shown as the green square. The small black squares show the dark galaxies from Janowiecki et al. (2015), the black open circles and triangle are those from Cannon et al. (2015). The black cross is SECCO 1 (AGC 226067) from Beccari et al. (2017). The black points and the black dashed line are the HI-selected spirals and their median HI mass, respectively, from Parkash et al. (2018). The small yellow circles and error bars are the HI bearing UDGs and the mean dispersion from Leisman et al. (2017), respectively. The black dot-dashed line marks the HI mass detection limit of the ALFALFA survey (Martin et al. 2010).
Current usage metrics show cumulative count of Article Views (full-text article views including HTML views, PDF and ePub downloads, according to the available data) and Abstracts Views on Vision4Press platform.
Data correspond to usage on the plateform after 2015. The current usage metrics is available 48-96 hours after online publication and is updated daily on week days.
Initial download of the metrics may take a while.