Fig. 10.
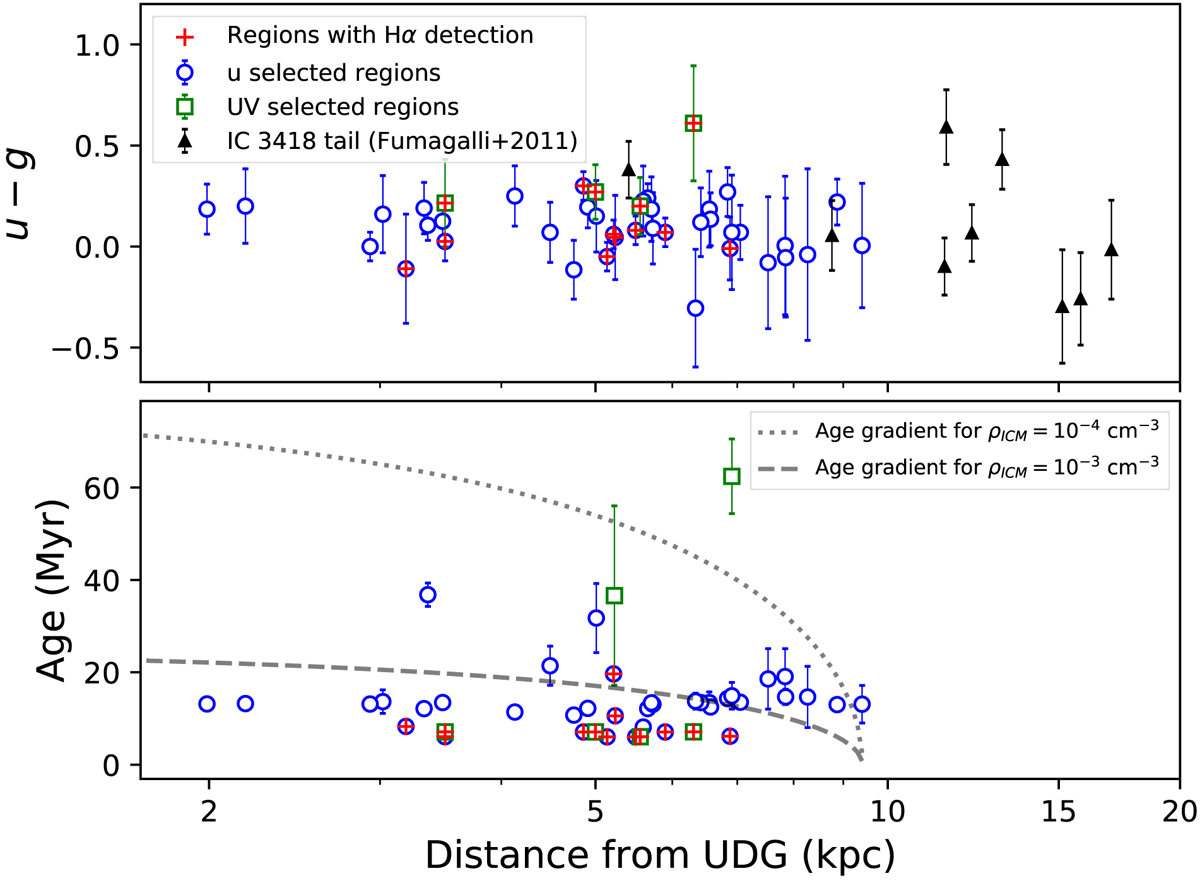
u − g color and age of our blue regions as a function of their distance from the center of the UDG. Black triangles represent the knots and filaments from Fumagalli et al. (2011). The black dotted and dashed lines indicate the age gradients we measured for a 9.4 kpc stream following Eq. (2) of Kenney et al. (2014), for two different ICM densities with ρICM = 10−4 and 10−3 cm−3, respectively, as discussed in Sect. 4.2. The blue open circles and green open squares mark our u-band and UV-selected regions, respectively. The red crosses identify the Hα detected regions.
Current usage metrics show cumulative count of Article Views (full-text article views including HTML views, PDF and ePub downloads, according to the available data) and Abstracts Views on Vision4Press platform.
Data correspond to usage on the plateform after 2015. The current usage metrics is available 48-96 hours after online publication and is updated daily on week days.
Initial download of the metrics may take a while.