Fig. 6.
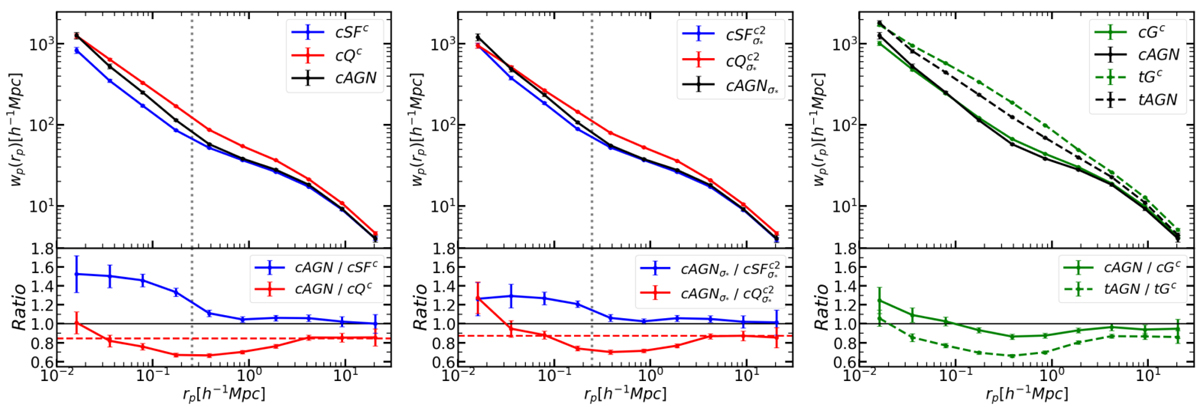
Cross-correlation function for AGNs and their control galaxies. Left panels, Upper panel: 2PCCF of cAGN (black) and its control star-forming (cSFc) and quiescent galaxies (cQc). Lower panel: 2PCCF ratio of cAGN to cSFc (blue) and cAGN to cQc (red). The horizontal dashed line (red) indicates the theoretical halo bias (Tinker et al. 2010) ratios between cAGN and cQc with halo mass derived by M1. The vertical dotted line (grey) indicates the virial radius of the host halo of cAGN derived by M2. Middle panels: same as the left panels, but for cAGNσ* and their control galaxies, cSF![]() and cQ
and cQ![]() . Right panels, Upper panel: 2PCCF for cAGN and its control galaxies (cGc), tAGN and its control galaxies (tGc). Lower panel: 2PCCF ratio of cAGN to cGc and tAGN to tGc. See Sect. 2.1 for the sample construction.
. Right panels, Upper panel: 2PCCF for cAGN and its control galaxies (cGc), tAGN and its control galaxies (tGc). Lower panel: 2PCCF ratio of cAGN to cGc and tAGN to tGc. See Sect. 2.1 for the sample construction.
Current usage metrics show cumulative count of Article Views (full-text article views including HTML views, PDF and ePub downloads, according to the available data) and Abstracts Views on Vision4Press platform.
Data correspond to usage on the plateform after 2015. The current usage metrics is available 48-96 hours after online publication and is updated daily on week days.
Initial download of the metrics may take a while.