Fig. 4.
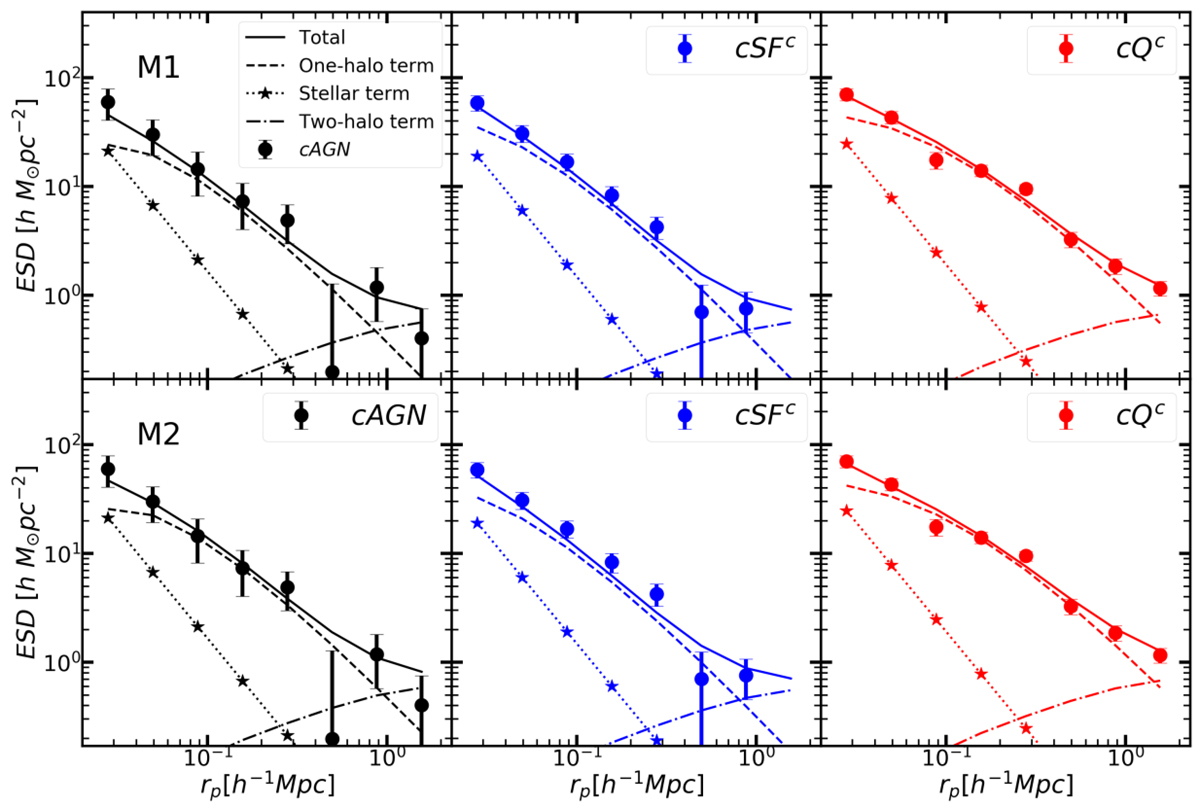
Lensing signal and the best fitting results for cAGN (black, left column), cSFc (blue, middle column), and cQc (red, right column) with different methods (the upper row is for M1, the lower row for M2). In each panel, the dots with error bars are the lensing signal, while the dashed line, dotted line with stars, and point line represent contribution from a one-halo term, stellar mass term, and two-halo term, respectively. The total fitting result is indicated by the solid line.
Current usage metrics show cumulative count of Article Views (full-text article views including HTML views, PDF and ePub downloads, according to the available data) and Abstracts Views on Vision4Press platform.
Data correspond to usage on the plateform after 2015. The current usage metrics is available 48-96 hours after online publication and is updated daily on week days.
Initial download of the metrics may take a while.