Free Access
Fig. 2.
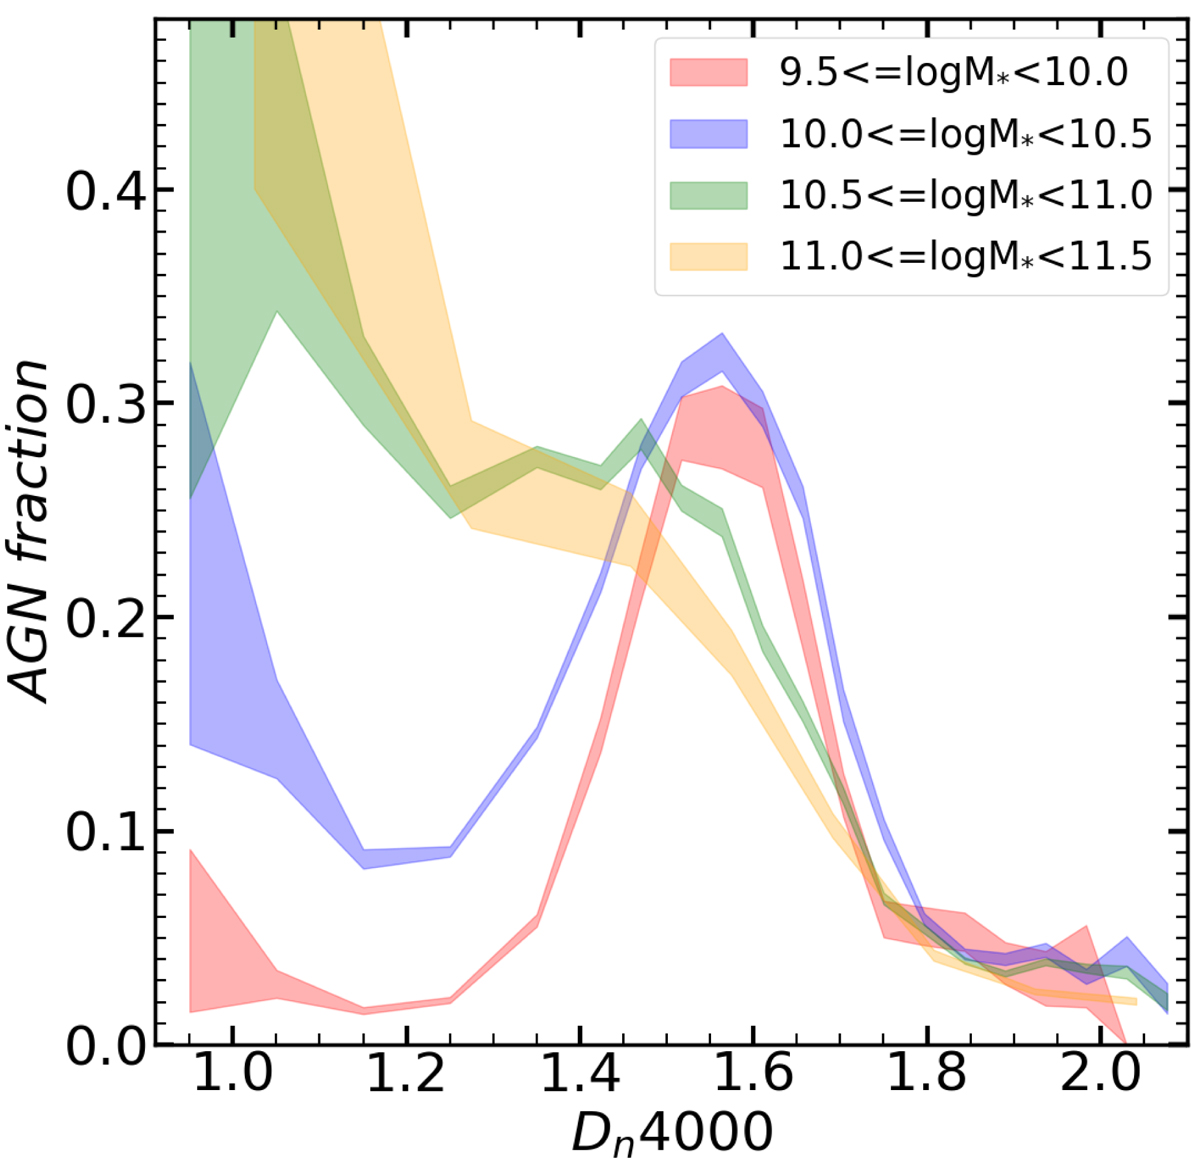
AGN fraction in central galaxies as a function of Dn4000 in four stellar mass bins as indicated by different colors. The shaded regions represent the scatter of the fraction which is calculated by using 100 bootstrap samples. We note that Vmax correction is used in calculating the fraction. See the text for details.
Current usage metrics show cumulative count of Article Views (full-text article views including HTML views, PDF and ePub downloads, according to the available data) and Abstracts Views on Vision4Press platform.
Data correspond to usage on the plateform after 2015. The current usage metrics is available 48-96 hours after online publication and is updated daily on week days.
Initial download of the metrics may take a while.