Fig. B.2.
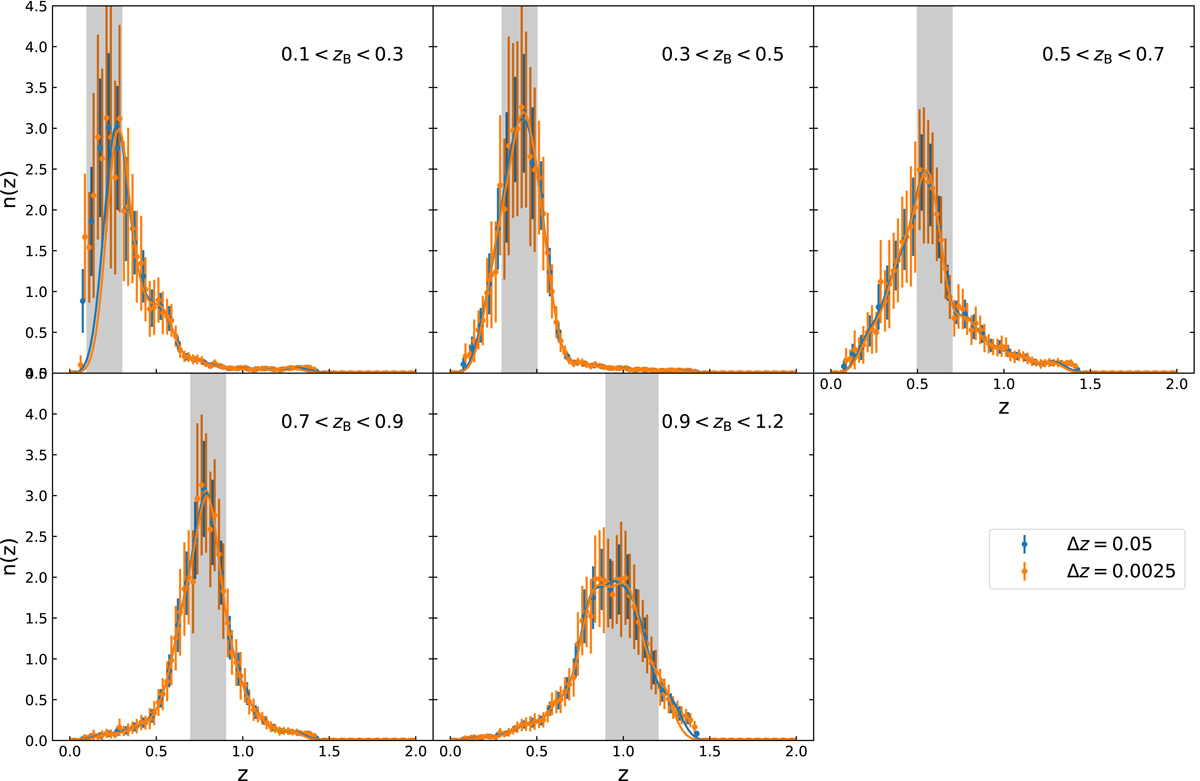
Comparison of the Gaussian comb with 30 components fitted to pre-calibrated histograms from the MICE simulation. The blue and orange points show histograms with bin widths of Δz = 0.05 and Δz = 0.025, respectively. The error bars correspond to the diagonal elements of the covariance matrix. The lines represent the Gaussian comb with 30 components fitted to the data histograms. We note that when fitting the redshift distribution, the full covariance matrix of the data histogram is taken into account.
Current usage metrics show cumulative count of Article Views (full-text article views including HTML views, PDF and ePub downloads, according to the available data) and Abstracts Views on Vision4Press platform.
Data correspond to usage on the plateform after 2015. The current usage metrics is available 48-96 hours after online publication and is updated daily on week days.
Initial download of the metrics may take a while.