Fig. 5.
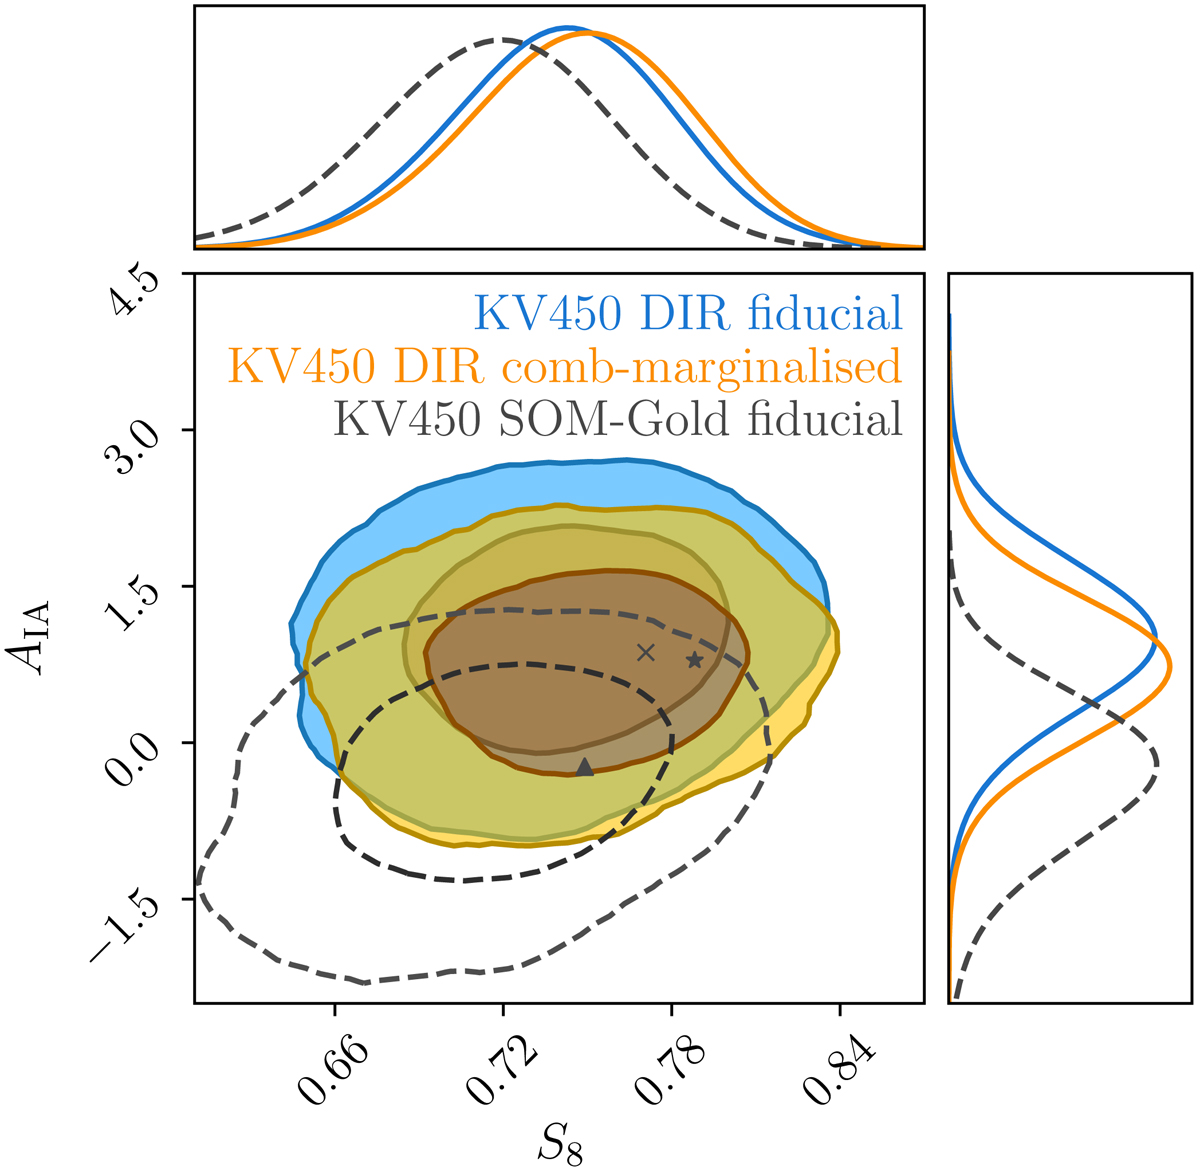
Marginalised posteriors for AIA and S8. The orange contours present the results from the KV450 likelihood with a self-calibrated Gaussian comb and analytical marginalisation over nuisance parameters, while the blue contours refer to the fiducial KV450 constraints. The star indicates the best-fit values from Table 2 for the KV450 likelihood with a Gaussian comb, and the cross indicates the best-fit values for the fiducial KV450 likelihood. The dashed contour shows the posterior distribution from the KV450 ‘gold’ sample (Wright et al. 2020b), which is constructed by removing photometric sources that are not directly represented by the overlapping spectroscopic reference samples using SOMs. Therefore, this contour is inferred from a different sample of galaxies with a different redshift distribution.
Current usage metrics show cumulative count of Article Views (full-text article views including HTML views, PDF and ePub downloads, according to the available data) and Abstracts Views on Vision4Press platform.
Data correspond to usage on the plateform after 2015. The current usage metrics is available 48-96 hours after online publication and is updated daily on week days.
Initial download of the metrics may take a while.