Fig. 4.
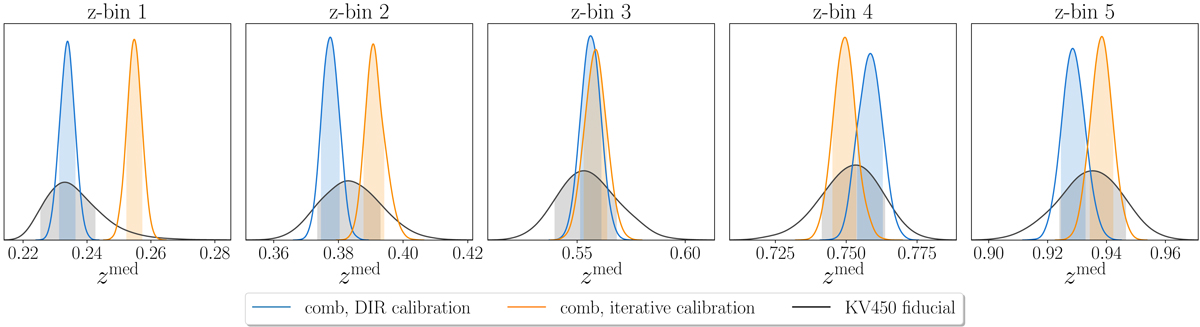
Posterior distribution of the median redshift of each tomographic redshift bin, inferred by drawing realisations of the Gaussian comb amplitudes from a multivariate Gaussian distribution. Black curves indicate the median redshift of the KV450 redshift histograms calibrated using the fiducial DIR method. The blue curves show the median redshift of the Gaussian comb that is fitted to the DIR histograms. The orange curves represent the median redshift of the Gaussian comb after iterative self-calibration with cosmic shear measurements.
Current usage metrics show cumulative count of Article Views (full-text article views including HTML views, PDF and ePub downloads, according to the available data) and Abstracts Views on Vision4Press platform.
Data correspond to usage on the plateform after 2015. The current usage metrics is available 48-96 hours after online publication and is updated daily on week days.
Initial download of the metrics may take a while.