Fig. 2.
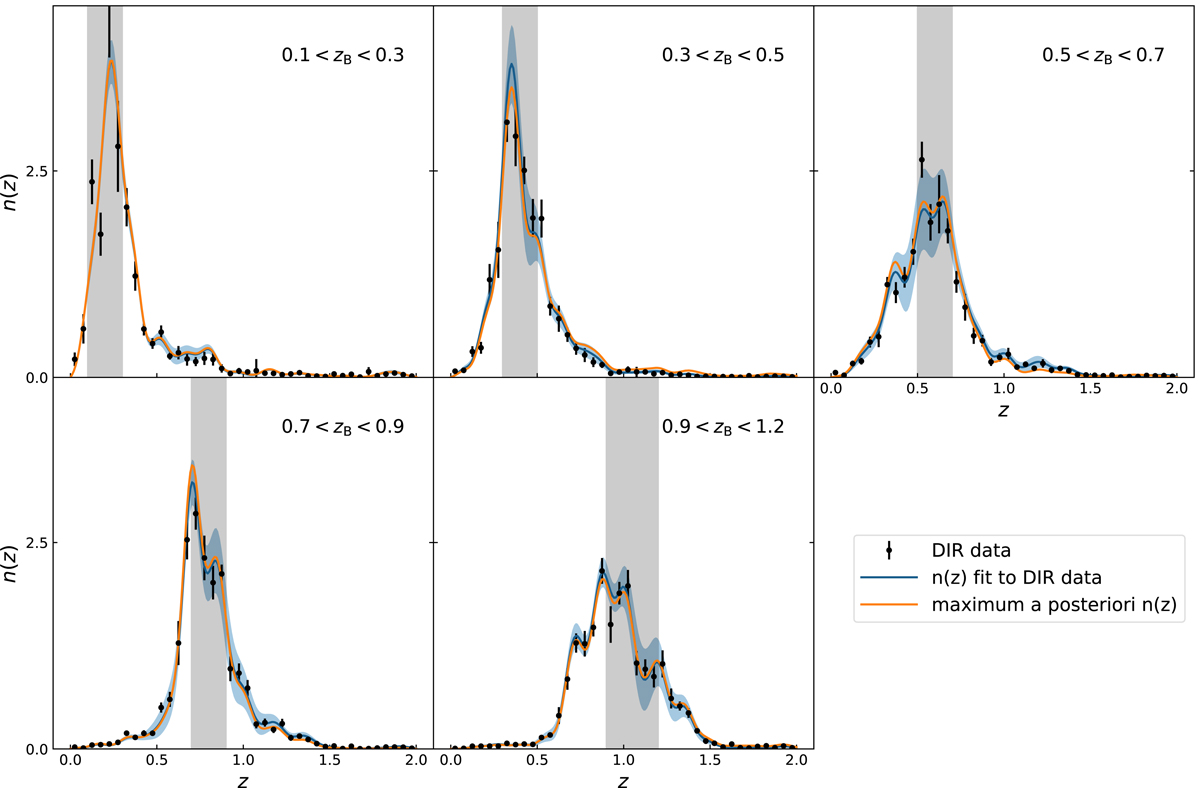
Fit results of a Gaussian mixture with 30 components to the redshift distribution in five tomographic redshift bins. Blue curves indicate redshift distributions fitted to the pre-calibrated DIR redshift histograms, shown in black. Shaded regions indicate the uncertainties on the redshift distributions derived from the diagonal elements of the correlation matrix of fit parameters, shown in Fig. 3. Orange curves represent the redshift distributions after iterative optimisation of cosmological and nuisance parameters.
Current usage metrics show cumulative count of Article Views (full-text article views including HTML views, PDF and ePub downloads, according to the available data) and Abstracts Views on Vision4Press platform.
Data correspond to usage on the plateform after 2015. The current usage metrics is available 48-96 hours after online publication and is updated daily on week days.
Initial download of the metrics may take a while.