Fig. 9.
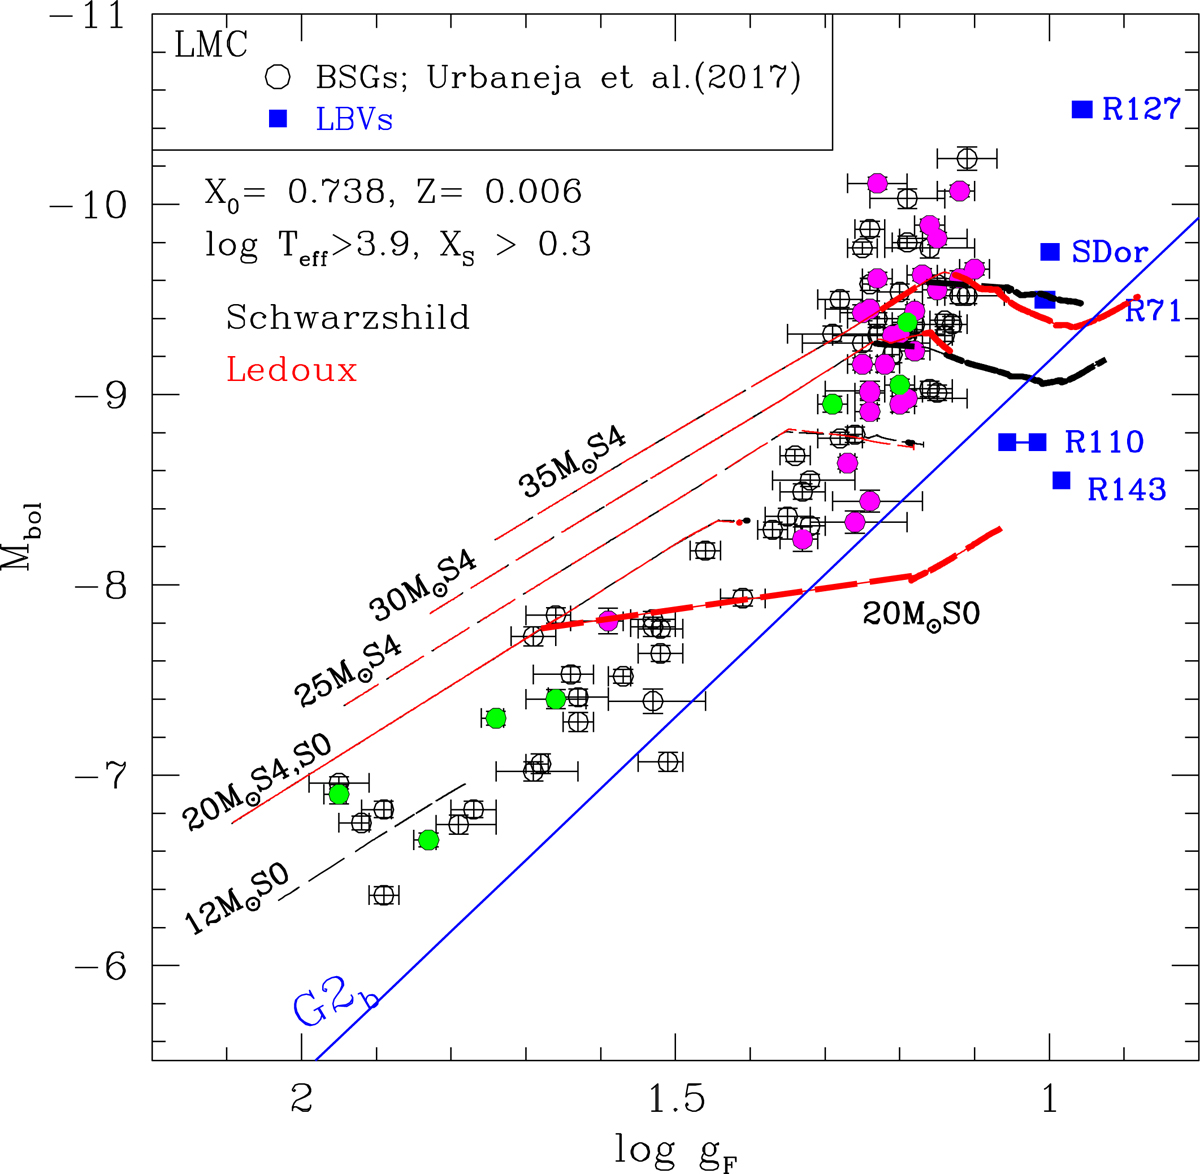
LMC blue supergiants analysed by Urbaneja et al. (2017) are plotted with circles in the log gF − Mbol plane. The colour of the circles have the same meaning as in Fig. 7. The blue straight line labelled as G2b is the lower boundary of the FGLR of BSGs in Local group galaxies (Meynet et al. 2015b). Blue parts (log Teff > 3.9) of some evolutionary tracks with Z = 0.006 are also plotted, where thick line parts indicate where radial pulsations are excited. The labels ‘S0’ and ‘S4’ refer to models with an initial rotation rate of 0 and 0.4 of the critical one, respectively. Some LBVs are plotted with filled squares for comparison, which clearly indicate that LBVs have experienced significant mass losses.
Current usage metrics show cumulative count of Article Views (full-text article views including HTML views, PDF and ePub downloads, according to the available data) and Abstracts Views on Vision4Press platform.
Data correspond to usage on the plateform after 2015. The current usage metrics is available 48-96 hours after online publication and is updated daily on week days.
Initial download of the metrics may take a while.