Fig. 7.
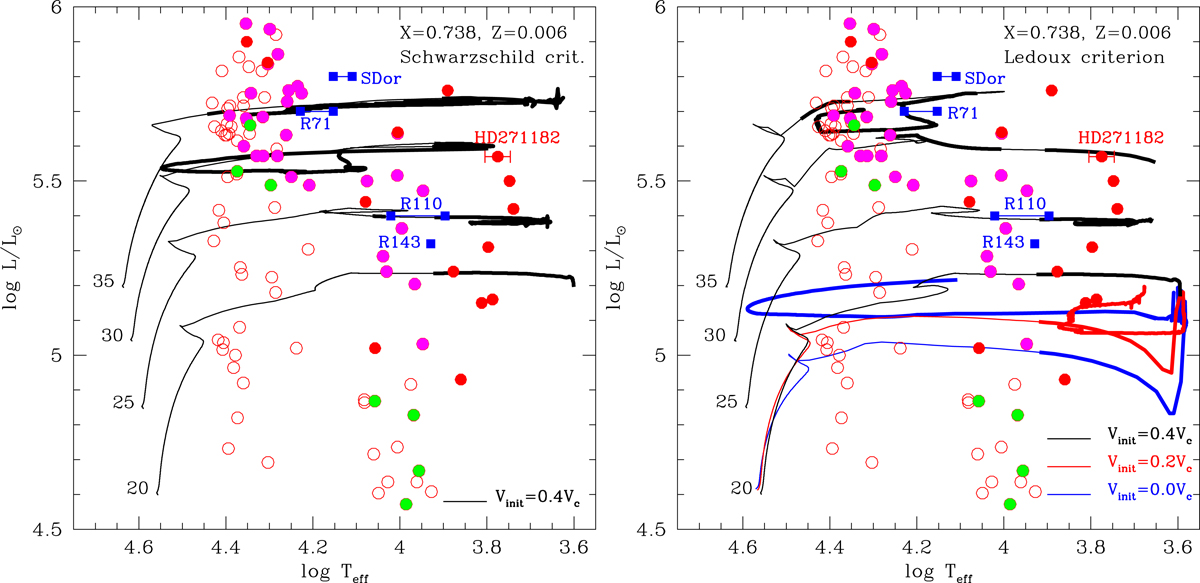
Evolutionary tracks in the HRD for Z = 0.006 with an initial rotation velocity of 0.4 times the critical value (black lines), of 0.2 times the critical value (red line), and without rotation (blue line). Left and right panels: are for models with the Schwarzschild criterion and the Ledoux criterion, respectively. Thick lines indicate the parts of the tracks where radial pulsations are excited. Blue supergiants (luminosity classes of Ia, Iab) in the LMC are also shown: Blue squares connected with horizontal lines are LBVs (S Dor, R 71, R 110, R 143; from brighter to fainter), for which parameters are obtained from Stahl et al. (1990), Lamers et al. (1998), van Genderen (2001). Red filled circles are known LMC α Cyg variables, whose parameters are given in Table 2. The other circles show the positions of BSGs of which parameters were obtained by Urbaneja et al. (2017). The photometric variability of each of these BSGs has been examined using the Fourier analysis software PERIOD04 (Lenz & Breger 2005) for the G-band lightcurve data from the ASAS-SN database (Shappee et al. 2014; Jayasinghe et al. 2019). Based on the analysis, we show non-variables with open circles, probable α Cyg variables (with clear periodicities shorter than ∼100 days) with filled magenta circles, and marginal variables with filled green circles.
Current usage metrics show cumulative count of Article Views (full-text article views including HTML views, PDF and ePub downloads, according to the available data) and Abstracts Views on Vision4Press platform.
Data correspond to usage on the plateform after 2015. The current usage metrics is available 48-96 hours after online publication and is updated daily on week days.
Initial download of the metrics may take a while.