Fig. 3.
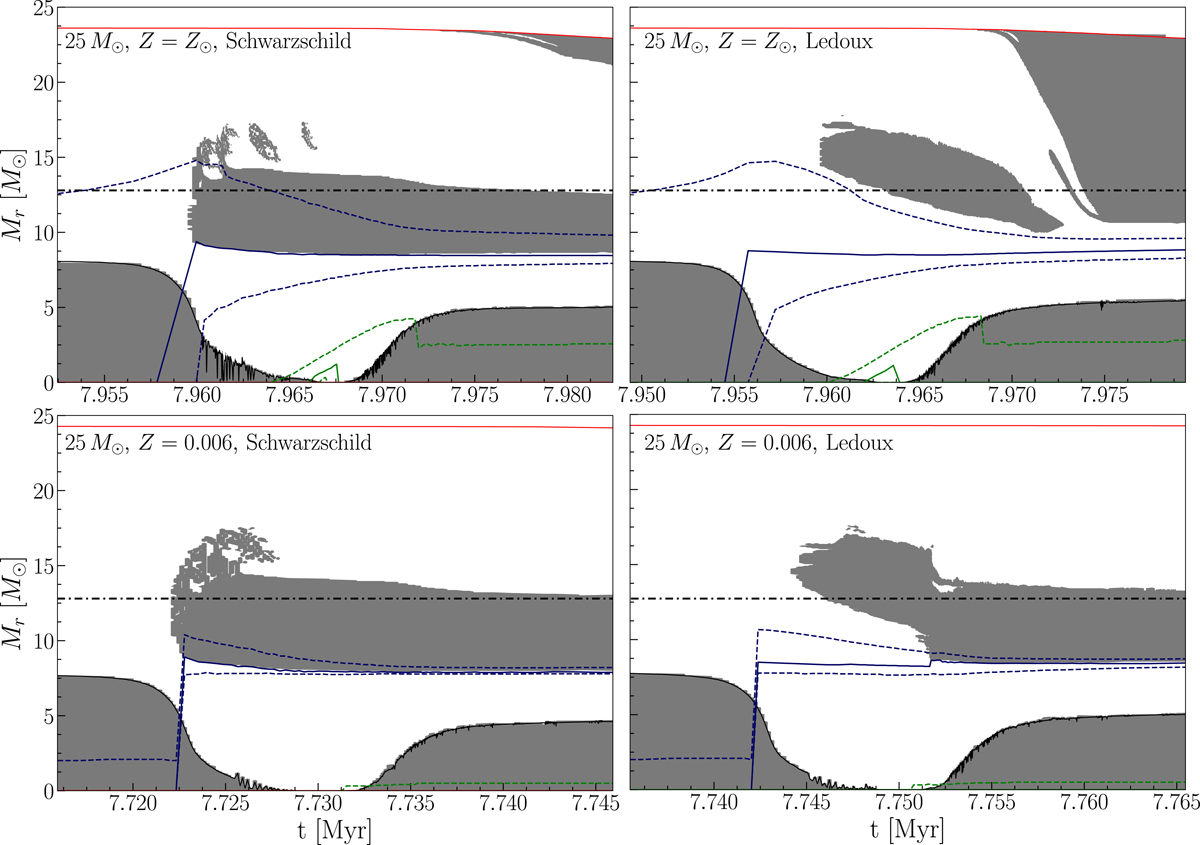
Kippenhahn diagrams for four representative models of 25 M⊙: solar metallicity (top row), and Z = 0.006 (bottom row); computed with the Schwarzschild criterion (left column) or Ledoux criterion (right column). Grey zones indicate that this part of the star is convective. The mass coordinate of the surface is shown with a red line. Maxima of the energy generation rate are indicated for H burning (blue solid line) and He burning (green solid line). The dashed lines indicate, for H and He-burning respectively, the level where the energy generation rate reaches 100 [erg s−1 g−1]. The dot-dashed line shows the mass-coordinate of the convective core on the ZAMS. It roughly shows the upper boundary of the region in which H-burning has proceeded and, therefore, has increased the chemical gradient. Due to rotational mixing, the exact extension of the region where a significant chemical gradient is present is slightly larger.
Current usage metrics show cumulative count of Article Views (full-text article views including HTML views, PDF and ePub downloads, according to the available data) and Abstracts Views on Vision4Press platform.
Data correspond to usage on the plateform after 2015. The current usage metrics is available 48-96 hours after online publication and is updated daily on week days.
Initial download of the metrics may take a while.