Fig. 10.
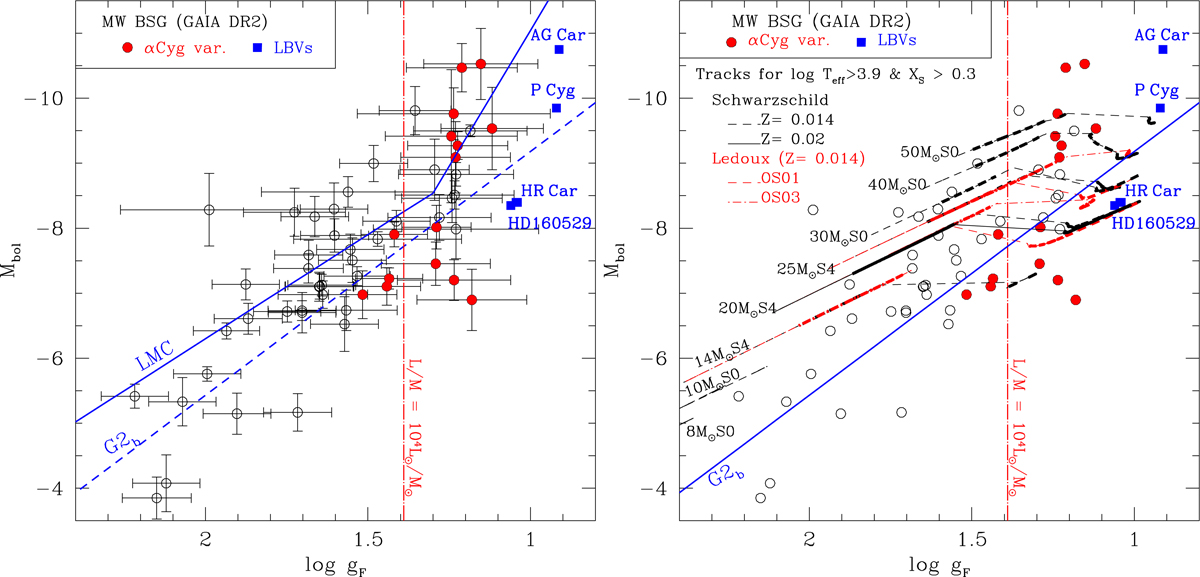
Left: absolute bolometric magnitudes Mbol versus flux-weighted gravity gF of Galactic blue supergiants are plotted with error bars. For most of the stars, Gaia DR2 parallaxes (Gaia Collaboration 2018) are used. A blue line indicates the mean relation of LMC blue supergiants obtained by Urbaneja et al. (2017). The blue dashed line labelled G2b corresponds to the relation log L/L⊙ = 3log M/M⊙ + 2.03 (Meynet et al. 2015b), which gives the lower bound of the FGLR for the BSGs of Local Group galaxies. Right: blue parts (log Teff > 3.9) of evolutionary tracks with various parameters are compared. The labels ‘S0’ and ‘S4’ refer to models with an initial rotation rate of 0 and 0.4 of the critical one, respectively. Some Galactic LBVs are shown by filled blue squares. The loci on the gF − Mbol diagram clearly indicate that significant mass losses have occurred in LBVs.
Current usage metrics show cumulative count of Article Views (full-text article views including HTML views, PDF and ePub downloads, according to the available data) and Abstracts Views on Vision4Press platform.
Data correspond to usage on the plateform after 2015. The current usage metrics is available 48-96 hours after online publication and is updated daily on week days.
Initial download of the metrics may take a while.