Open Access
Fig. 7
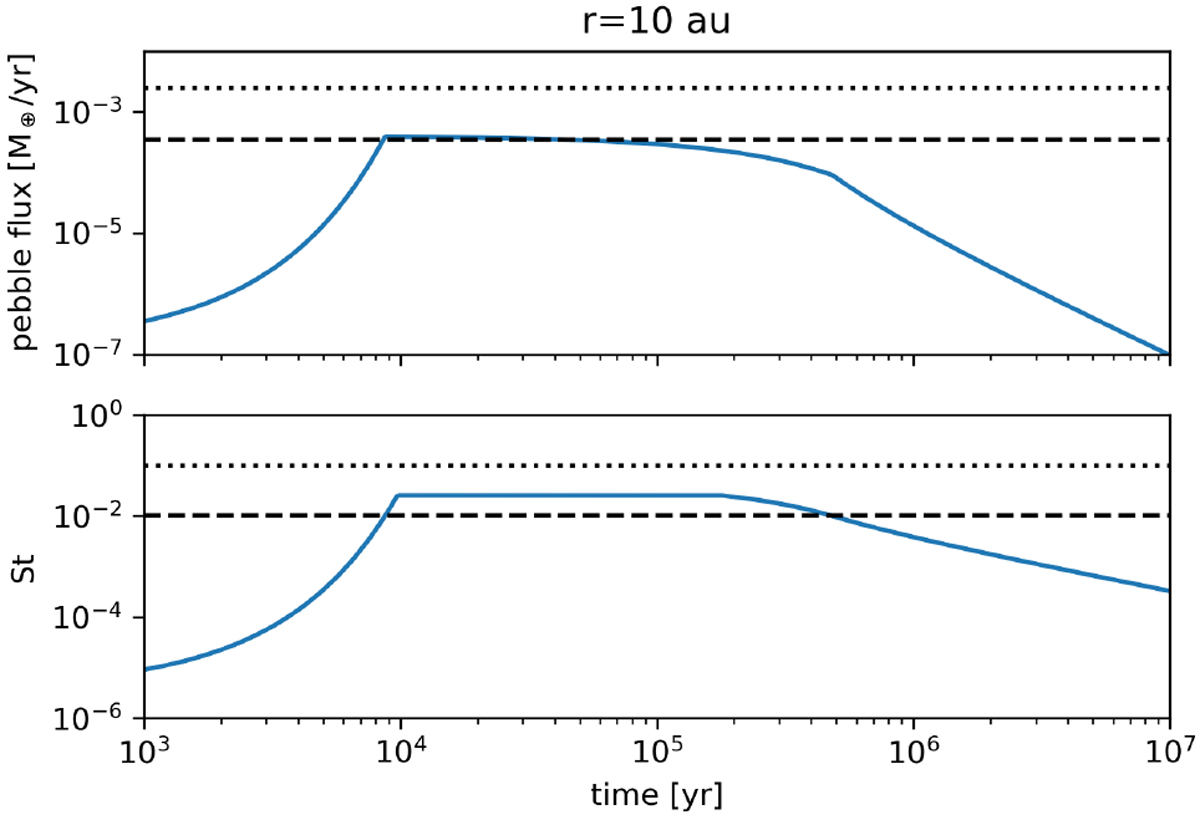
Pebble flux over time, calculated with the pebble predictor tool using the same disk initial conditions. Overplotted are the values from our simulation results, from model ST1 (dotted line) and model ST2 (dashed line).
Current usage metrics show cumulative count of Article Views (full-text article views including HTML views, PDF and ePub downloads, according to the available data) and Abstracts Views on Vision4Press platform.
Data correspond to usage on the plateform after 2015. The current usage metrics is available 48-96 hours after online publication and is updated daily on week days.
Initial download of the metrics may take a while.