Free Access
Fig. 8.
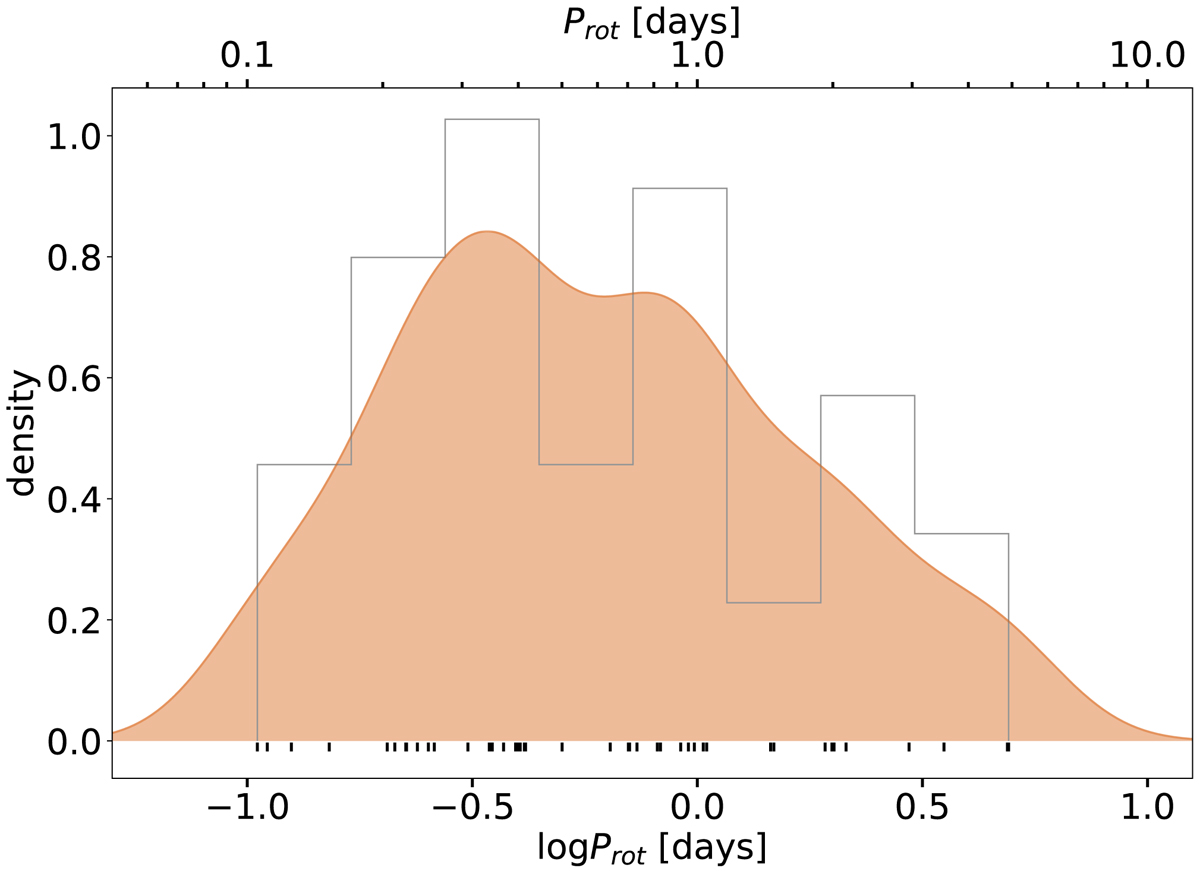
Rotational period distribution of the sample with TESS. The one-dimensional kernel density estimation plotted with orange is calculated with a Gaussian kernel with bandwidth of 0.15. The black ticks show the individual period values. Only periods below 5d were kept owing to the 27d baseline of TESS sectors.
Current usage metrics show cumulative count of Article Views (full-text article views including HTML views, PDF and ePub downloads, according to the available data) and Abstracts Views on Vision4Press platform.
Data correspond to usage on the plateform after 2015. The current usage metrics is available 48-96 hours after online publication and is updated daily on week days.
Initial download of the metrics may take a while.