Free Access
Fig. 6.
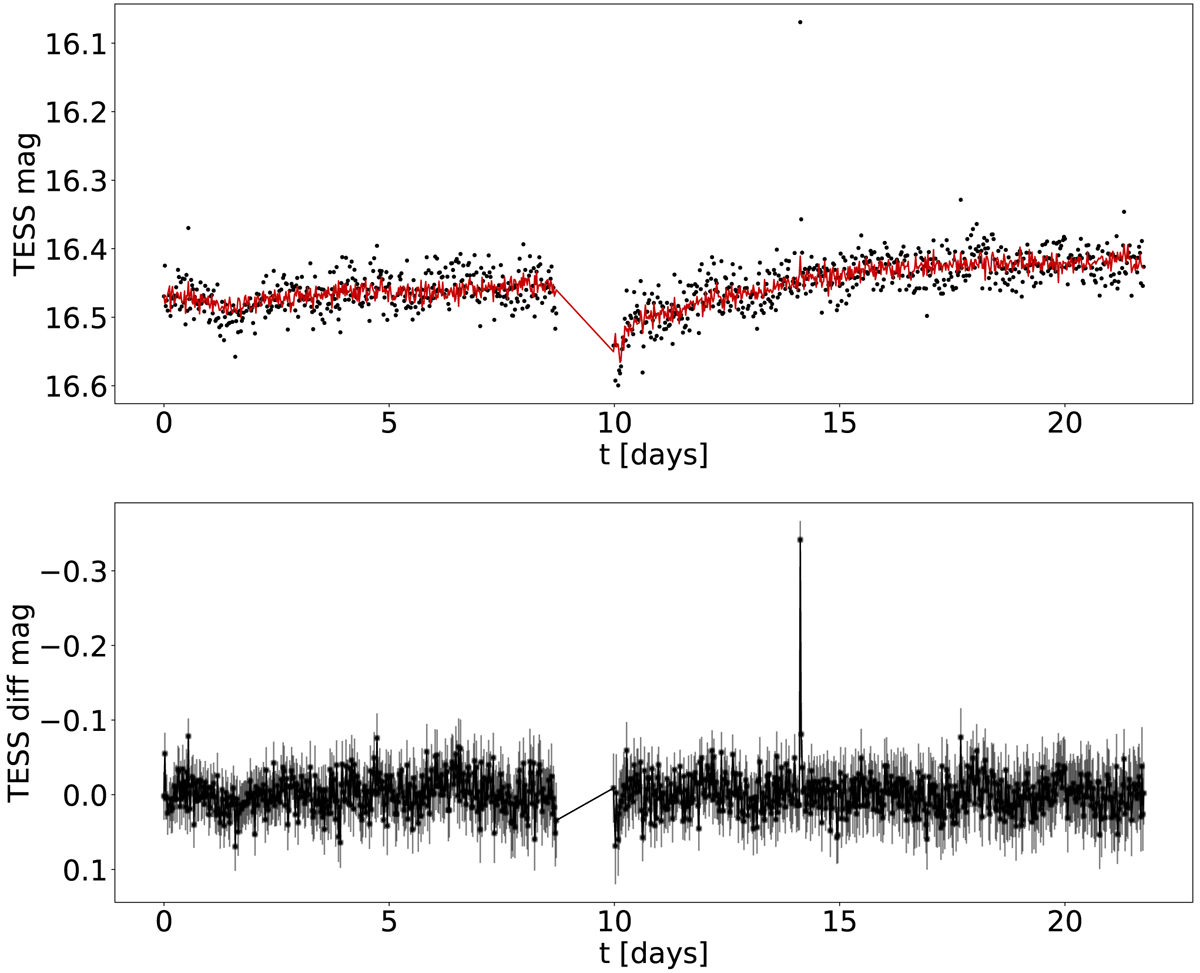
PCA reconstruction of the light curve from Fig. 5. The black points in the upper panel show the light curve created by QDLP_EXTRACT; the red curve shows the PCA reconstruction. The corrected light curve can be seen in the lower panel, showing a dominant flare and periodic variation.
Current usage metrics show cumulative count of Article Views (full-text article views including HTML views, PDF and ePub downloads, according to the available data) and Abstracts Views on Vision4Press platform.
Data correspond to usage on the plateform after 2015. The current usage metrics is available 48-96 hours after online publication and is updated daily on week days.
Initial download of the metrics may take a while.