Free Access
Fig. 5.
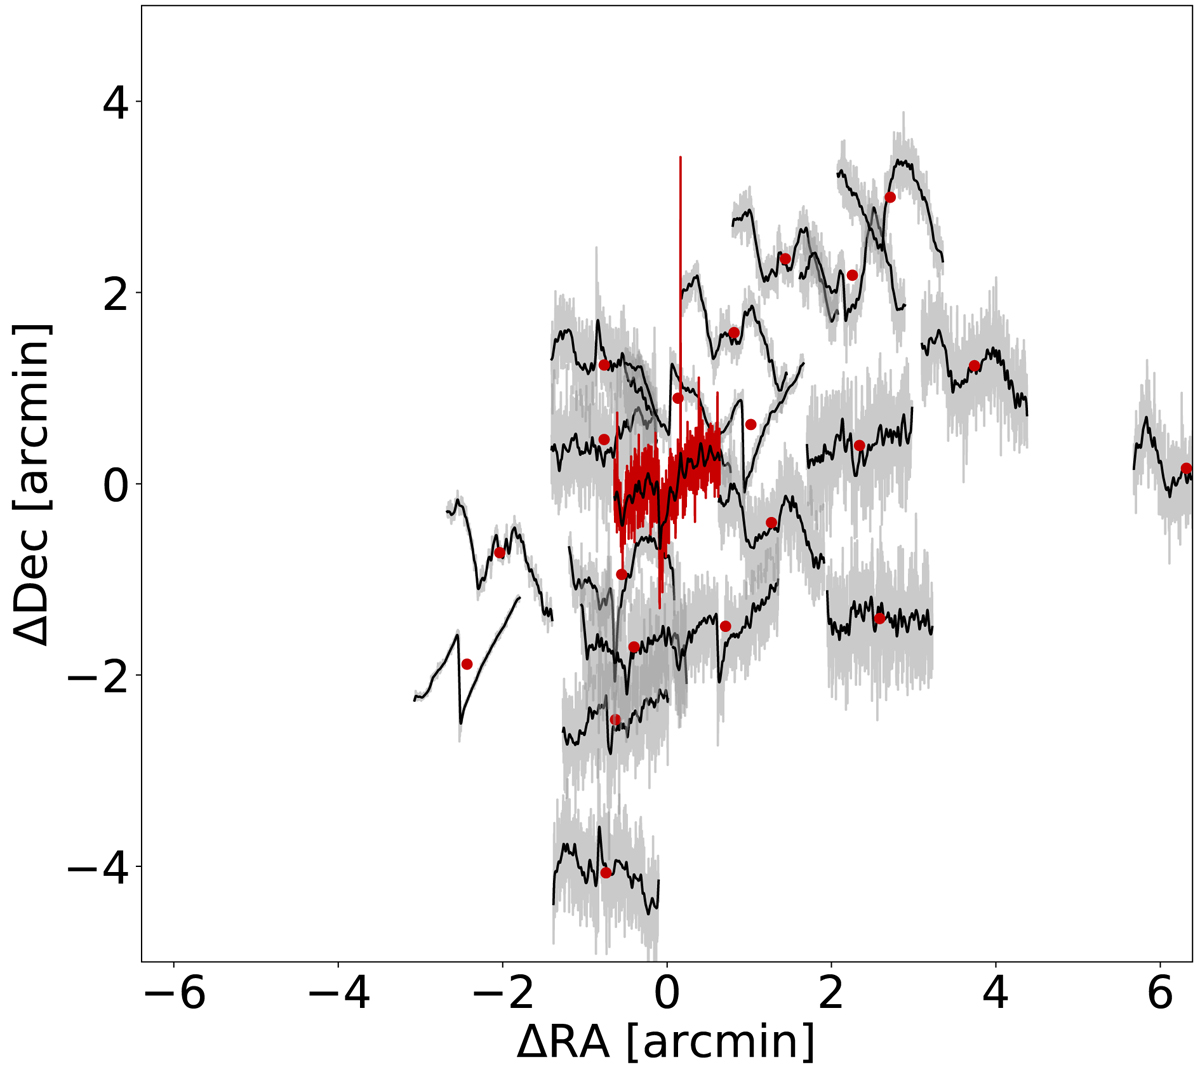
Extracted light curves from the circular apertures of Fig. 4, with red dots indicating the celestial position of the sources. Some common trends can be identified, while the large flare seen on the target (red curve) does not seem to appear anywhere else.
Current usage metrics show cumulative count of Article Views (full-text article views including HTML views, PDF and ePub downloads, according to the available data) and Abstracts Views on Vision4Press platform.
Data correspond to usage on the plateform after 2015. The current usage metrics is available 48-96 hours after online publication and is updated daily on week days.
Initial download of the metrics may take a while.