Free Access
Fig. 22.
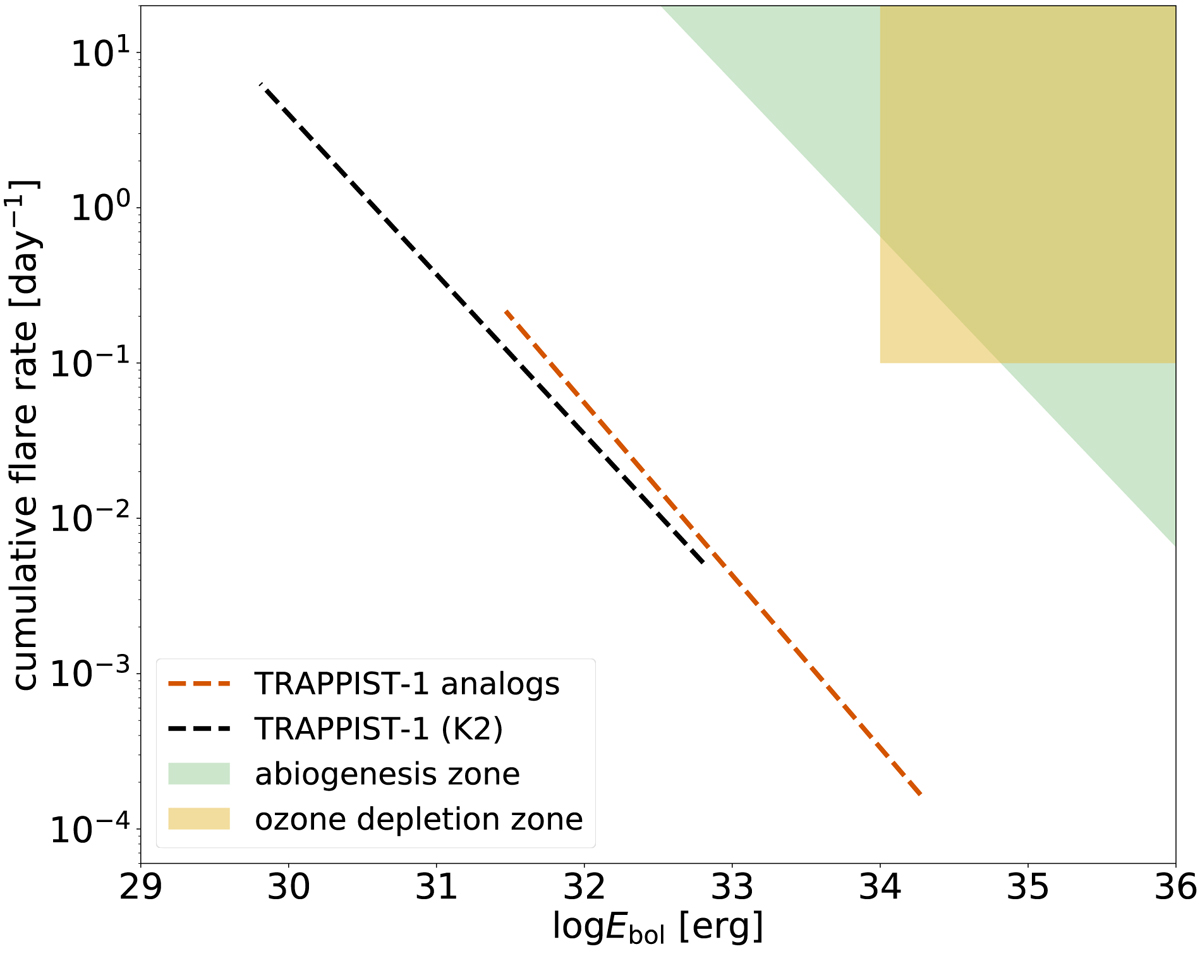
Flare frequency distribution showing the region where abiogenesis is possible (Rimmer et al. 2018) and where ozone depletion can occur (Tilley et al. 2019), following Günther et al. (2020). The dashed lines indicate the linear fits from Fig. 21; Ebol is used instead of ETESS.
Current usage metrics show cumulative count of Article Views (full-text article views including HTML views, PDF and ePub downloads, according to the available data) and Abstracts Views on Vision4Press platform.
Data correspond to usage on the plateform after 2015. The current usage metrics is available 48-96 hours after online publication and is updated daily on week days.
Initial download of the metrics may take a while.