Fig. 2.
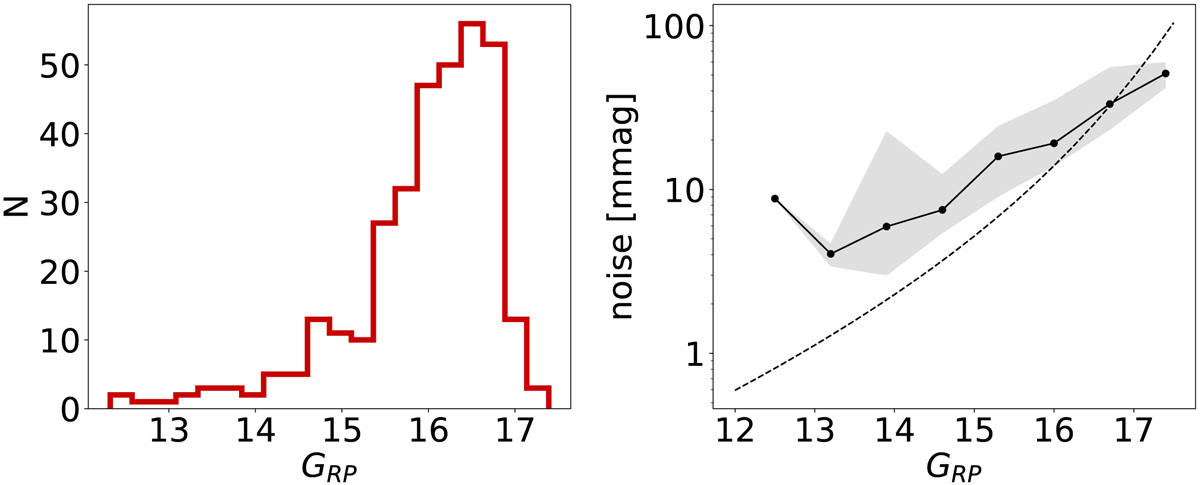
Photometric properties of the sample. Left: brightness distribution of the final sample. Right: noise properties of the sample. The black curve shows the photometric scatter measured on the final processed light curves. The region between the 16th and 84th percentiles is shown in grey. The dashed line is the predicted noise value from TICgen.
Current usage metrics show cumulative count of Article Views (full-text article views including HTML views, PDF and ePub downloads, according to the available data) and Abstracts Views on Vision4Press platform.
Data correspond to usage on the plateform after 2015. The current usage metrics is available 48-96 hours after online publication and is updated daily on week days.
Initial download of the metrics may take a while.