Free Access
Fig. 13.
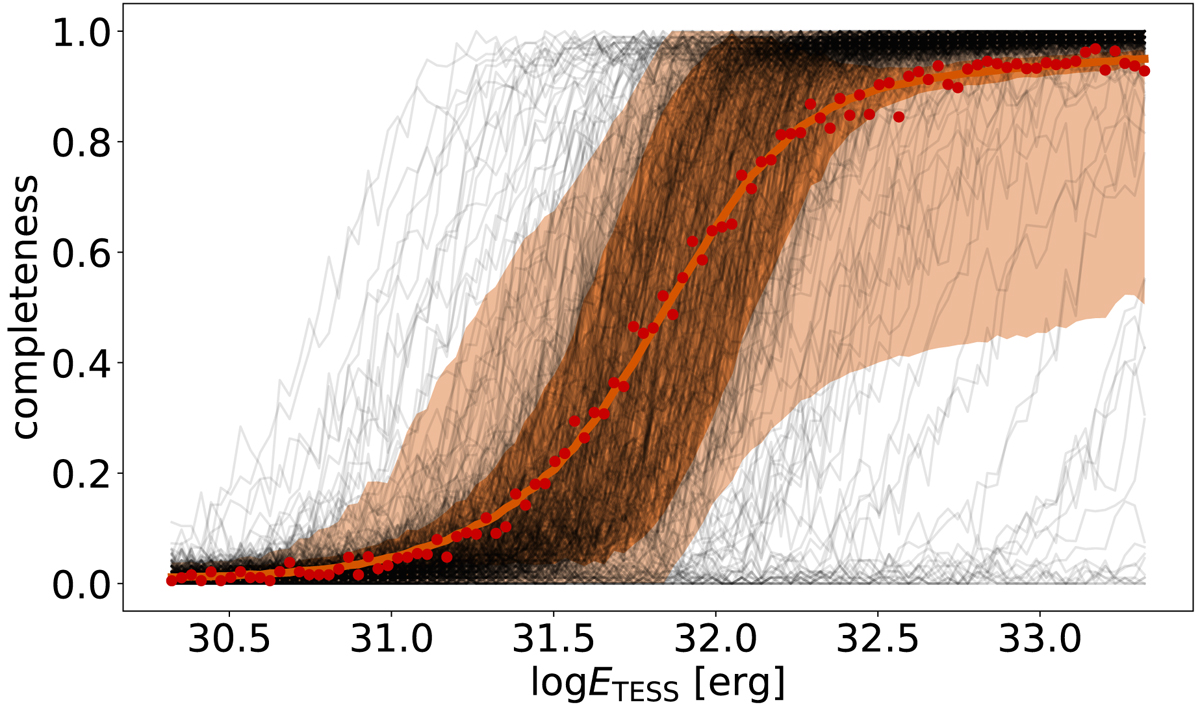
Flare recovery rate calculated for each light curve. The orange line shows the average curve for all stars and the red points show the completeness curve calculated for a concatenated light curve. The shaded regions show the 1σ and 2σ confidence intervals.
Current usage metrics show cumulative count of Article Views (full-text article views including HTML views, PDF and ePub downloads, according to the available data) and Abstracts Views on Vision4Press platform.
Data correspond to usage on the plateform after 2015. The current usage metrics is available 48-96 hours after online publication and is updated daily on week days.
Initial download of the metrics may take a while.