Free Access
Fig. 7.
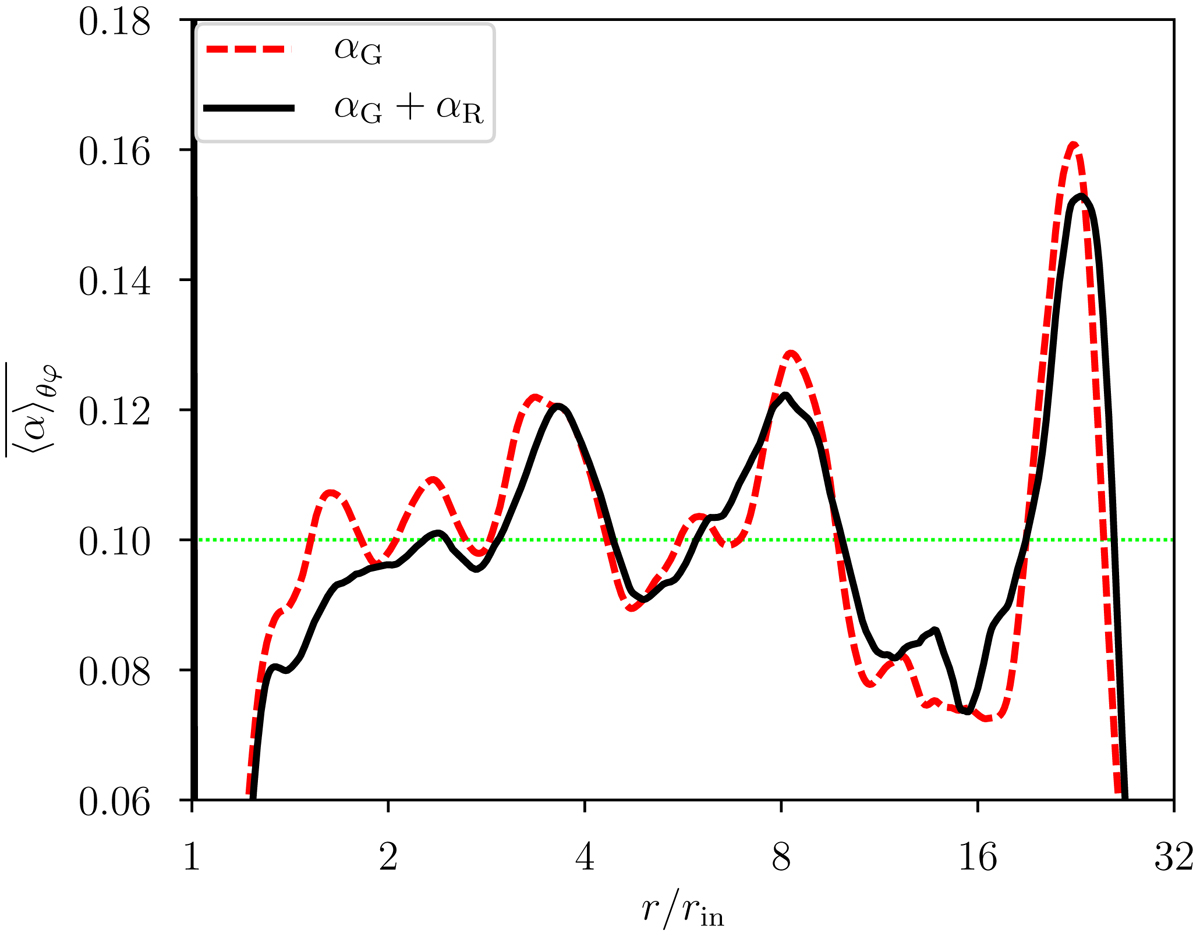
Radial profiles of the normalized total stress (solid black) and gravitational stress alone (dashed red) after spatial and time averaging over 181tin in run M3B10. The dotted horizontal line marks the expected value αLTE assuming a Keplerian shear rate in Eq. (21).
Current usage metrics show cumulative count of Article Views (full-text article views including HTML views, PDF and ePub downloads, according to the available data) and Abstracts Views on Vision4Press platform.
Data correspond to usage on the plateform after 2015. The current usage metrics is available 48-96 hours after online publication and is updated daily on week days.
Initial download of the metrics may take a while.