Free Access
Fig. B.2.
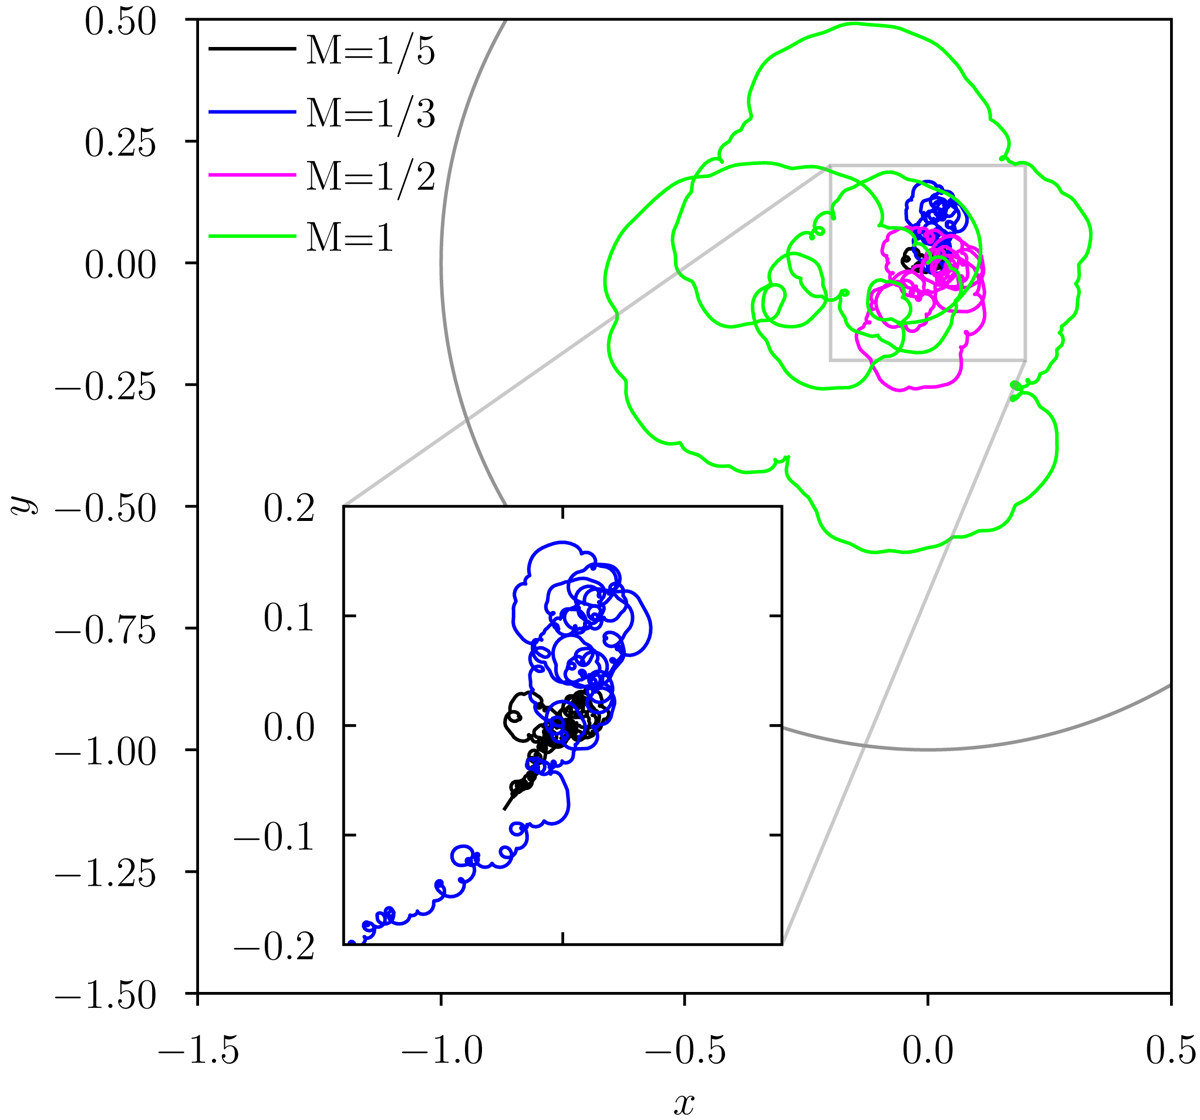
Trajectory of the central object reacting to the disk gravity from 100tin to 300tin in the equatorial plane for different disk masses (see legend). The gray arcs represent the inner boundary of the computational domain at a radius r = 1. The inset zooms on the innermost regions for the two least massive disks.
Current usage metrics show cumulative count of Article Views (full-text article views including HTML views, PDF and ePub downloads, according to the available data) and Abstracts Views on Vision4Press platform.
Data correspond to usage on the plateform after 2015. The current usage metrics is available 48-96 hours after online publication and is updated daily on week days.
Initial download of the metrics may take a while.