Fig. 14.
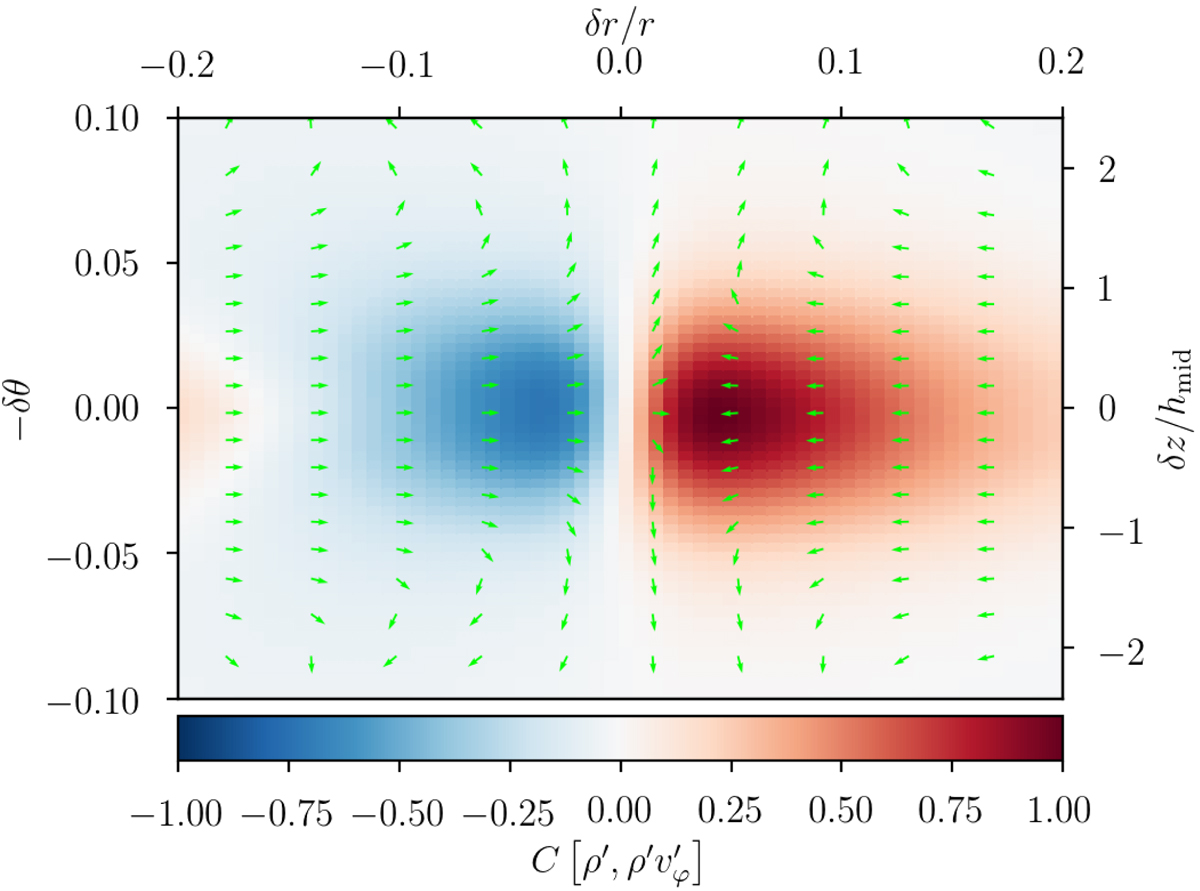
Mean meridional cross-correlation between the density fluctuations ρ′ and the momentum fluctuations ρ′v′. The arrows give the orientation of the meridional components of the flow while the blue-red colors map its azimuthal component with an arbitrary scale. The right axis indicates the corresponding height measured from the midplane in units of mean midplane pressure scales.
Current usage metrics show cumulative count of Article Views (full-text article views including HTML views, PDF and ePub downloads, according to the available data) and Abstracts Views on Vision4Press platform.
Data correspond to usage on the plateform after 2015. The current usage metrics is available 48-96 hours after online publication and is updated daily on week days.
Initial download of the metrics may take a while.