Fig. 11.
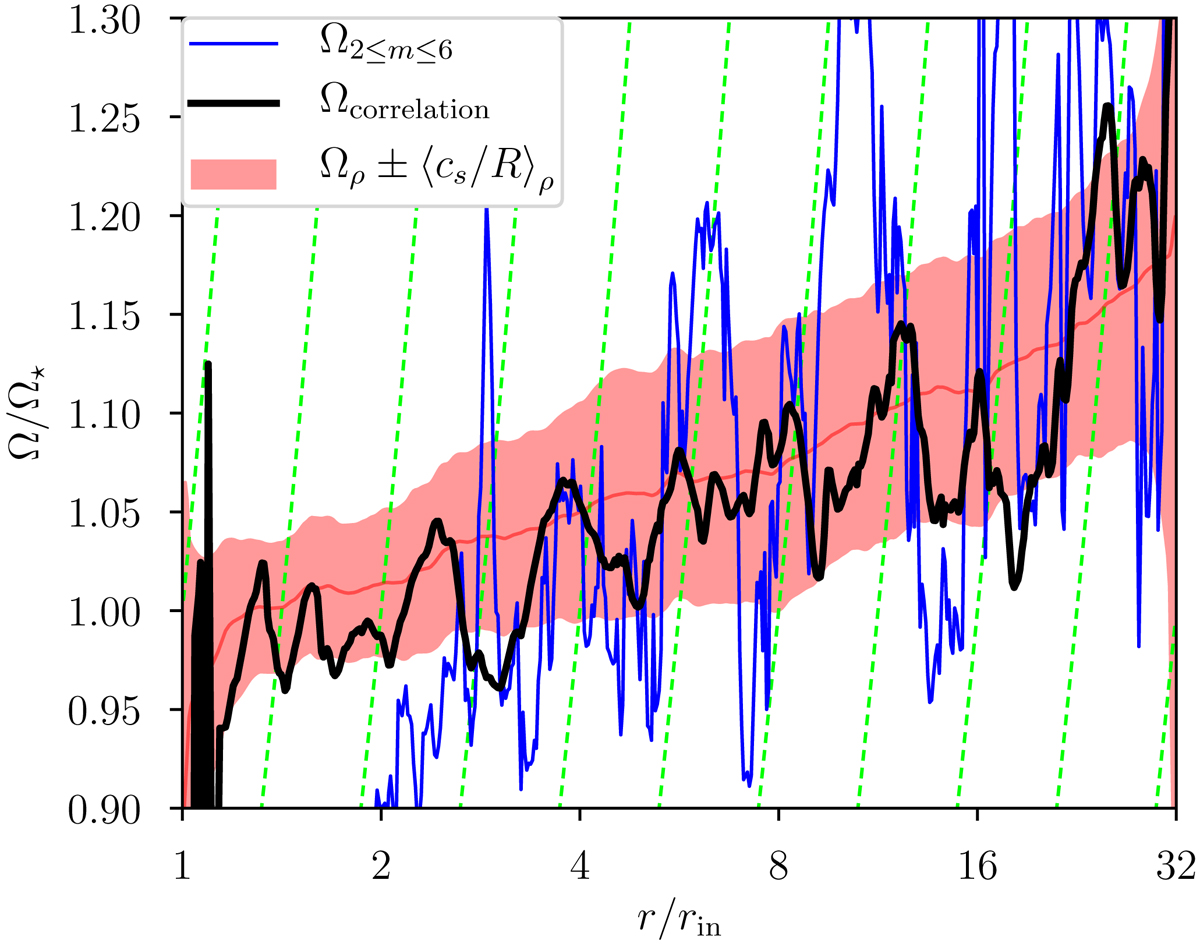
Radial profiles of angular velocities relative the Keplerian frequency Ω⋆ ∝ r−3/2 after averaging over 7.5tin in run M3B10. The red area encompasses the bulk orbital velocity plus or minus the bulk sound speed. The thin blue curve is the spiral pattern speed estimated from the 2 ≤ m ≤ 6 Fourier modes. The thick black curve is the pattern speed estimated by maximizing the time correlation Eq. (24). The dashed green lines are contours of constant angular velocity.
Current usage metrics show cumulative count of Article Views (full-text article views including HTML views, PDF and ePub downloads, according to the available data) and Abstracts Views on Vision4Press platform.
Data correspond to usage on the plateform after 2015. The current usage metrics is available 48-96 hours after online publication and is updated daily on week days.
Initial download of the metrics may take a while.