Fig. 10.
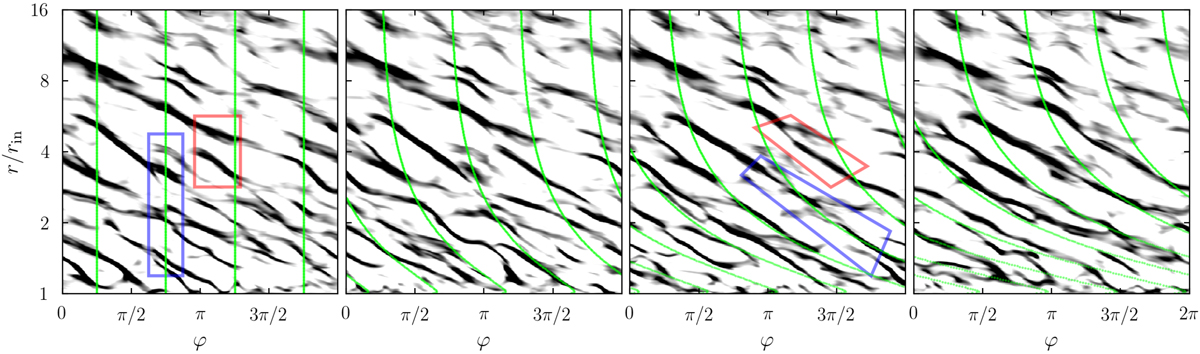
Relative density fluctuations at four consecutive times separated by 0.5tin in the equatorial plane of run M3B10. The gray scale covers ![]() . The green curves are transported at the mean orbital velocity ⟨vφ⟩ρ of the gas and serve as corotation references. The blue and red contours delimit initially disjoint wakes in the process of merging by the third snapshot.
. The green curves are transported at the mean orbital velocity ⟨vφ⟩ρ of the gas and serve as corotation references. The blue and red contours delimit initially disjoint wakes in the process of merging by the third snapshot.
Current usage metrics show cumulative count of Article Views (full-text article views including HTML views, PDF and ePub downloads, according to the available data) and Abstracts Views on Vision4Press platform.
Data correspond to usage on the plateform after 2015. The current usage metrics is available 48-96 hours after online publication and is updated daily on week days.
Initial download of the metrics may take a while.