Free Access
Fig. 1.
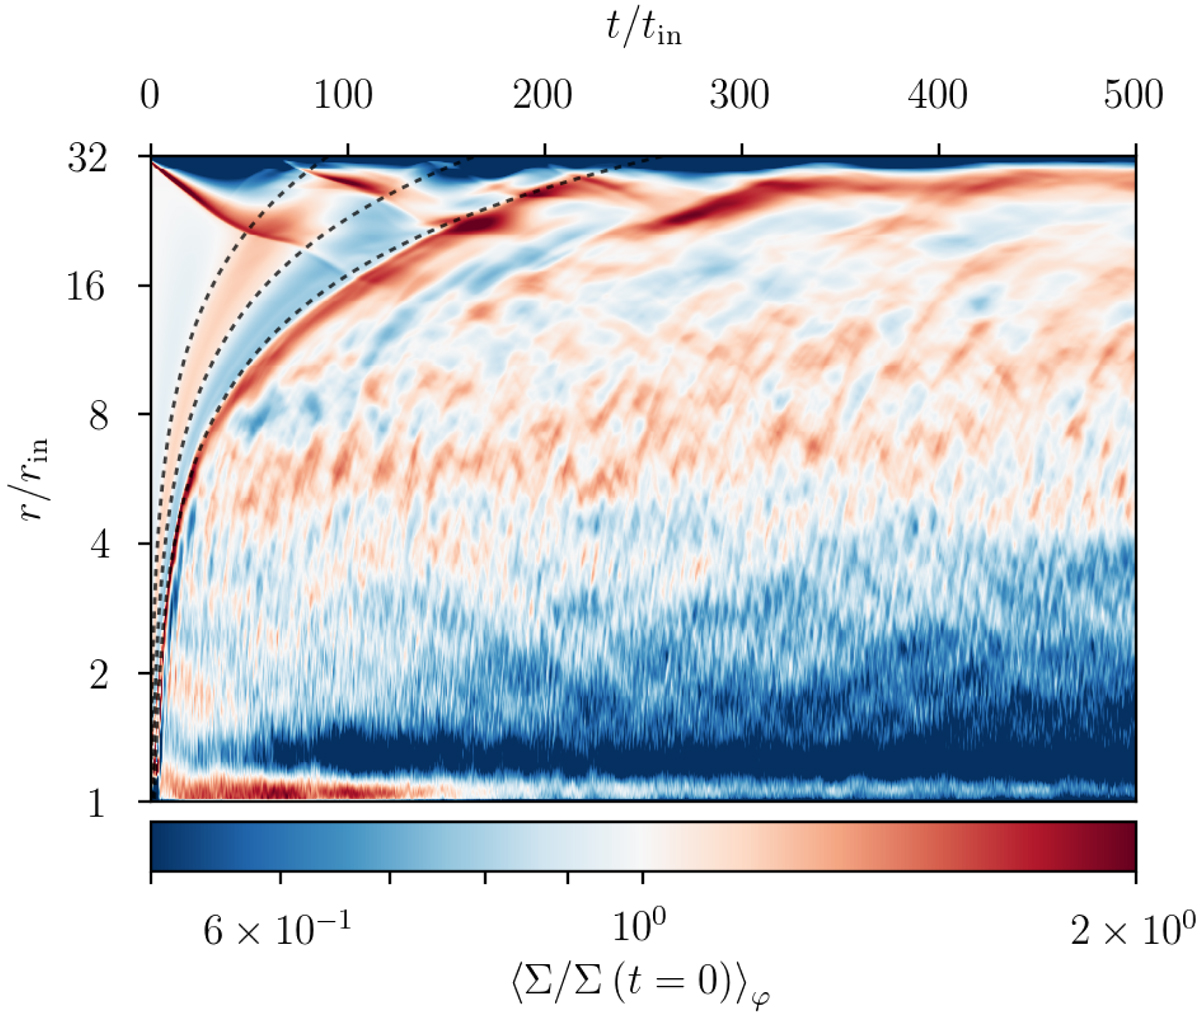
Evolution in time (horizontal axis) of the radial profile (vertical axis) of the gas surface density relative to its initial profile in run M3B10. The dashed curves on the left fit the initial transient fronts with r(t) ∝ t2/3, i.e., a radial velocity proportional to r−1/2.
Current usage metrics show cumulative count of Article Views (full-text article views including HTML views, PDF and ePub downloads, according to the available data) and Abstracts Views on Vision4Press platform.
Data correspond to usage on the plateform after 2015. The current usage metrics is available 48-96 hours after online publication and is updated daily on week days.
Initial download of the metrics may take a while.