Free Access
Fig. 1.
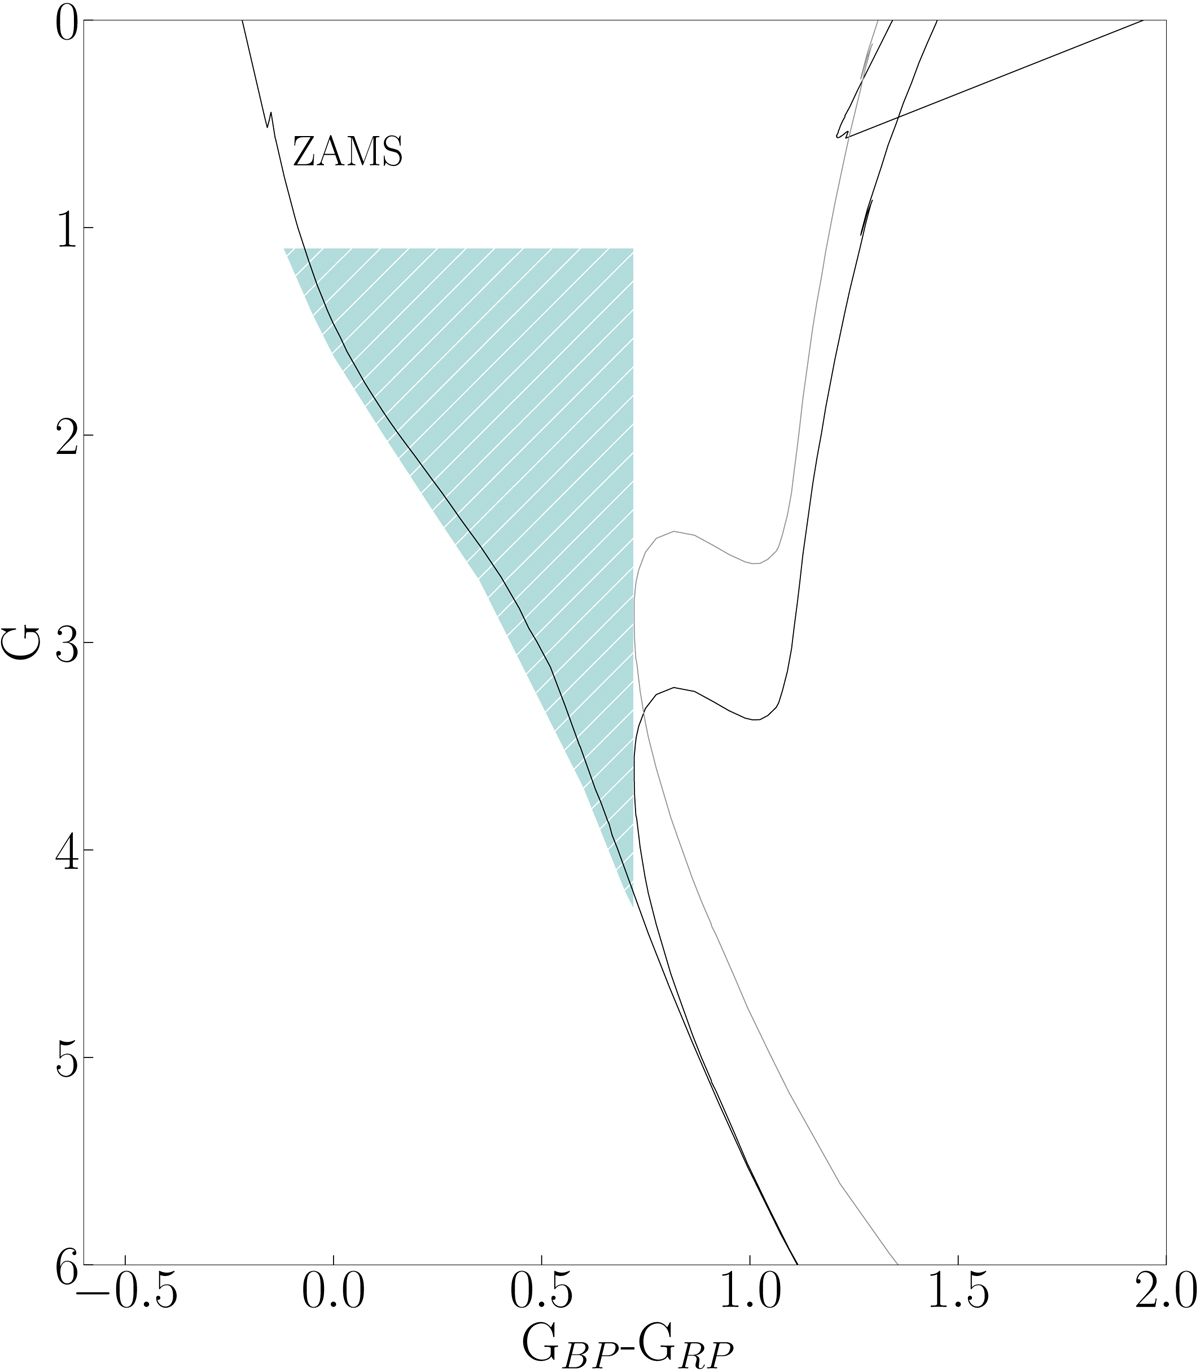
Schematic colour-magnitude diagram for an old open cluster; the isochrone corresponds to log(age) = 9.8. The blue straggler area is shaded in blue. The grey line indicates the equal-mass binary loci.
Current usage metrics show cumulative count of Article Views (full-text article views including HTML views, PDF and ePub downloads, according to the available data) and Abstracts Views on Vision4Press platform.
Data correspond to usage on the plateform after 2015. The current usage metrics is available 48-96 hours after online publication and is updated daily on week days.
Initial download of the metrics may take a while.