Fig. A.1.
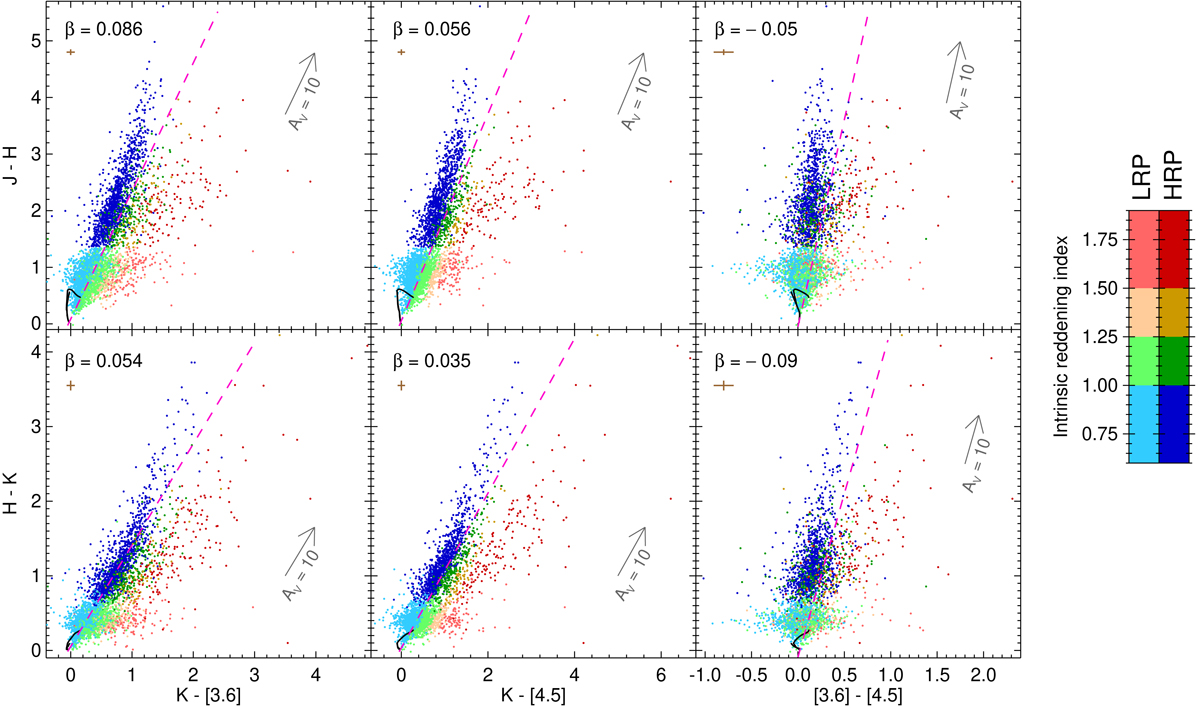
Color–color diagrams that are used to compute Rint, which is coded as indicated in the color bars for LRP and HRP sources. The reddening band boundaries that are used as a reference (see text) are drawn as dashed pink lines. The 1 Gyr isochrone for solar abundances is drawn in black. The average photometric errors are shown as brown bars just below the β values.
Current usage metrics show cumulative count of Article Views (full-text article views including HTML views, PDF and ePub downloads, according to the available data) and Abstracts Views on Vision4Press platform.
Data correspond to usage on the plateform after 2015. The current usage metrics is available 48-96 hours after online publication and is updated daily on week days.
Initial download of the metrics may take a while.