Fig. 7.
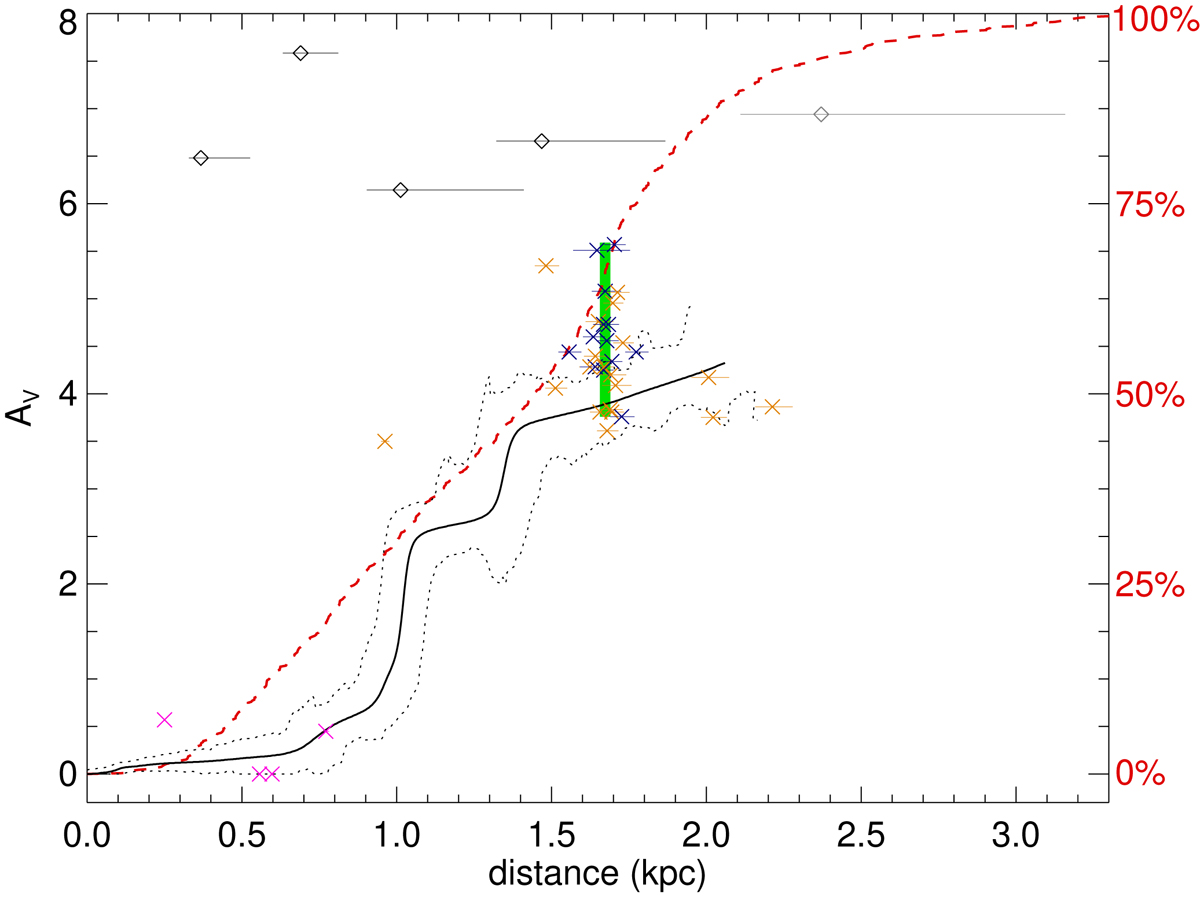
Visual extinction vs. distance estimates, colored as follows: blue shows spectroscopically confirmed Berkeley 87 members, orange shows photometric candidates for Berkeley 87 membership according to Turner & Forbes (1982), magenta shows additional stars of known spectral types, black shows sources that were not previously cataloged, and gray is explained below. Objects whose AV values are obtained in Sects. 4.1 and 4.2 are shown as crosses and diamonds, respectively. The Berkeley 87 distance and AV range are represented as a green rectangle. The extinction along the Berkeley 87 direction according to the Stilism map is drawn as a solid black curve. The errors are shown as dotted lines. The dashed red curve is the cumulative distribution (see the scale on the right axis) for the sample of 737 objects with valid distance results, i.e., those that fulfill 0 < fϖ ≤ 0.2. The gray data point is not part of this sample and is only included to illustrate the effects of relaxing the fϖ constraints (see text).
Current usage metrics show cumulative count of Article Views (full-text article views including HTML views, PDF and ePub downloads, according to the available data) and Abstracts Views on Vision4Press platform.
Data correspond to usage on the plateform after 2015. The current usage metrics is available 48-96 hours after online publication and is updated daily on week days.
Initial download of the metrics may take a while.