Fig. 6.
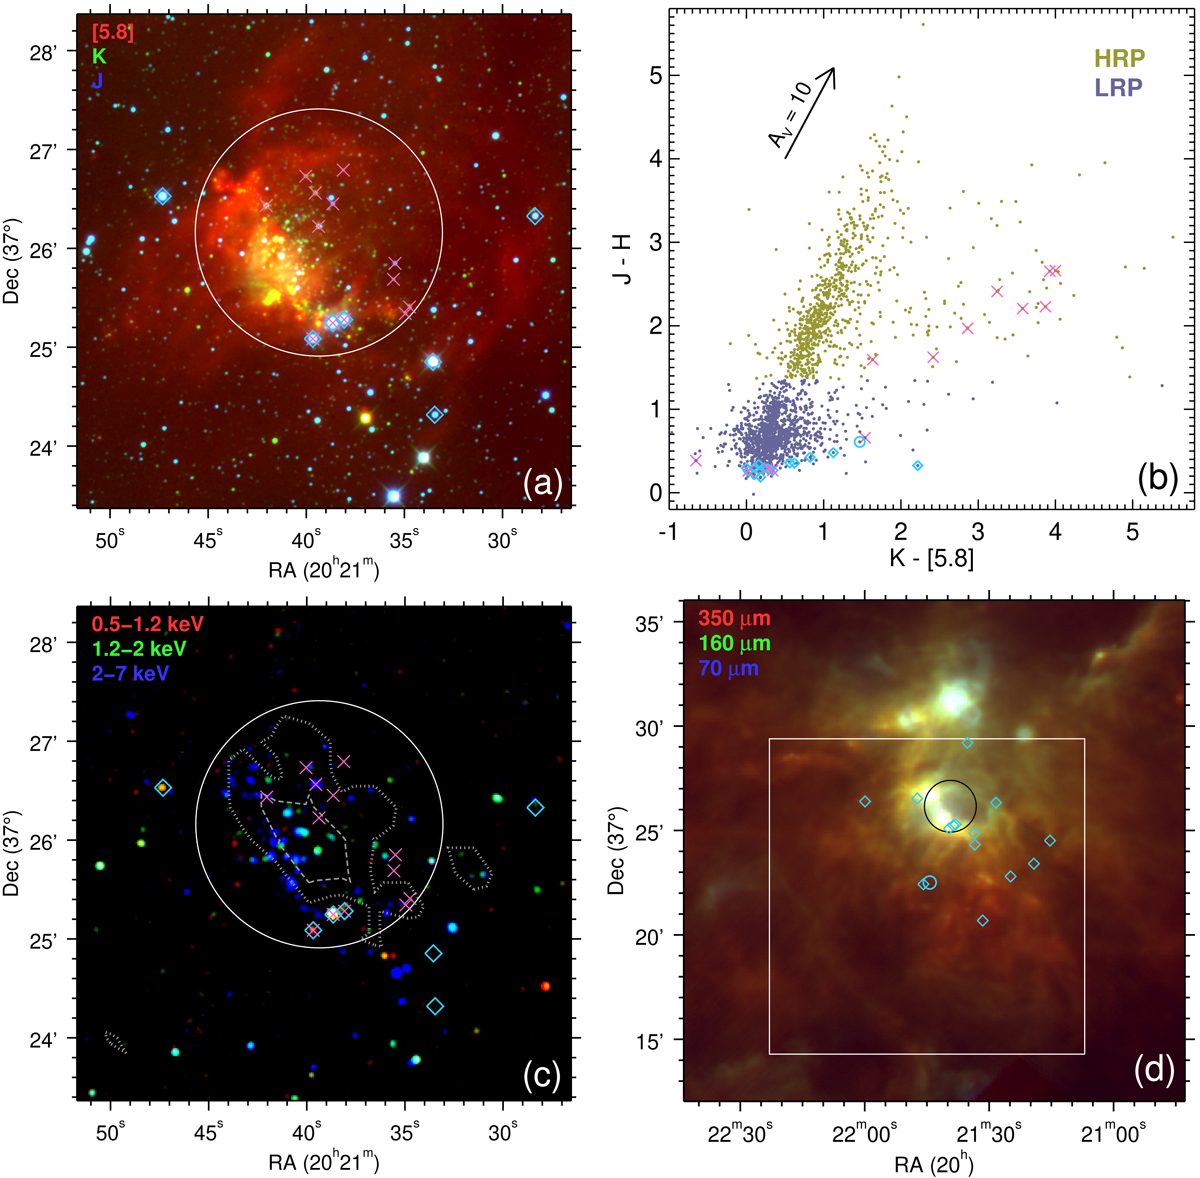
Multiwavelength RGB images (colored as indicated in the upper left corner of each image) of the Berkeley 87/ON2 region, and infrared color–color diagram of the OMEGA2000 field. The extinction vector that is shown in this diagram (panel b) is obtained from Indebetouw et al. (2005), and taking AK/AKS ≈ 0.98 (which is justified in Appendix A). In all the images, the Cl05 region is enclosed by a white or black circle. In the Herschel RGB image (d), the OMEGA2000 field coverage is shown as a white square. An infrared closeup of this field, centered on [DB2001] Cl05, is displayed in panel a, and its Chandra counterpart is shown in panel c. The latter is made of 2-pixel binned images from the 2009 observation; the density of J − H > 1.7 sources is drawn as gray contours (dotted = 55 arcmin−2; dashed = 110 arcmin−2). In all panels, Berkeley 87 spectroscopic members are marked as open blue diamonds, except for WR 142, which is shown as an open blue circle (only in panels b and d); crosses are point sources within the Cl05 region that are simultaneously detected in J, H, K, and [5.8] (i.e., those that are represented in panel b).
Current usage metrics show cumulative count of Article Views (full-text article views including HTML views, PDF and ePub downloads, according to the available data) and Abstracts Views on Vision4Press platform.
Data correspond to usage on the plateform after 2015. The current usage metrics is available 48-96 hours after online publication and is updated daily on week days.
Initial download of the metrics may take a while.